Hello! Our clients have increasingly expressed interest in the spatial aspects of digitalization. To cater to this demand, we will be regularly posting related content. We aim to simplify these complex concepts and open new avenues for our clients to benefit from. We highly value your feedback and interaction with our posts. This is intended for solution architects and product managers. If you happened to miss our previous posts, they are here and here. This comprehensive case study is divided into a detailed, step-by-step narrative spanning two parts. You are currently reading Part 1, and Part 2 can be found here. This is written with a step-by-step approach and aims to engage software professionals. We recognize the detailed nature of the content might make for a longer read, and we appreciate your patience. In the write-up, we'll address the reader as 'you'’ assuming you're either a software engineer, a GIS back-end developer, or a front-end developer. We will present suggested software names and their logos, and at times, we may capitalize, bold, or italicize these software names, but please note we may not always be consistent.
Case Study: Using Geographic Information System (GIS) to Map Property Values and Assess Property Taxes
A Software Architect’s Exploration of Open Source GIS Software and SDI-Considerations for GIS Application
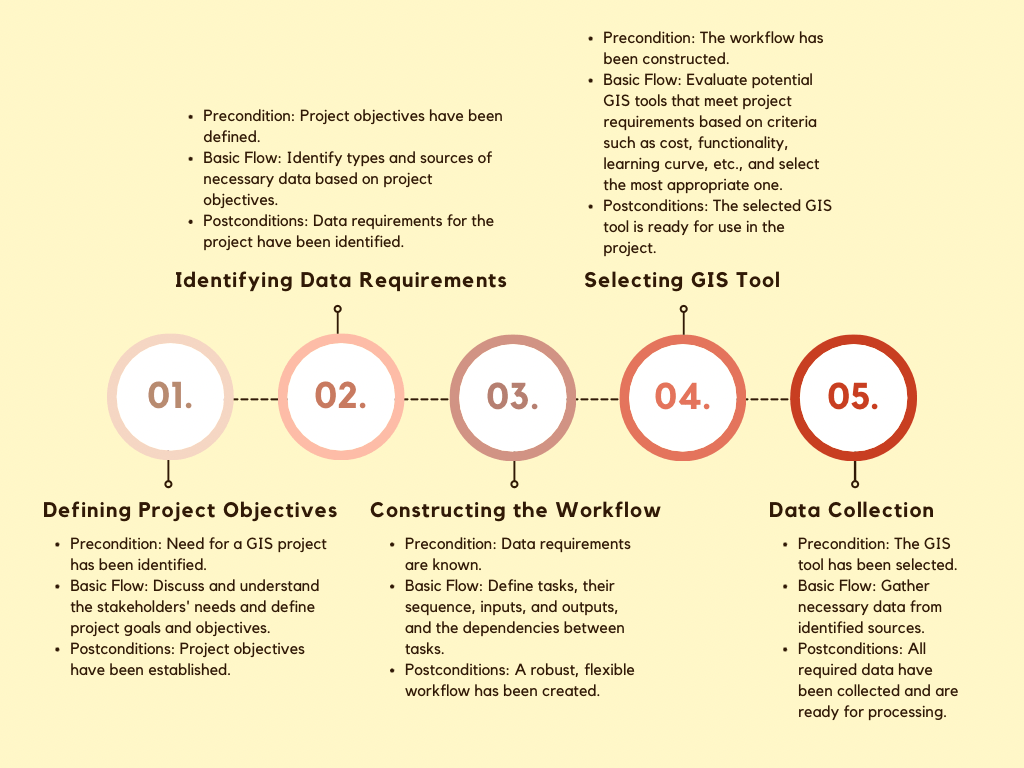
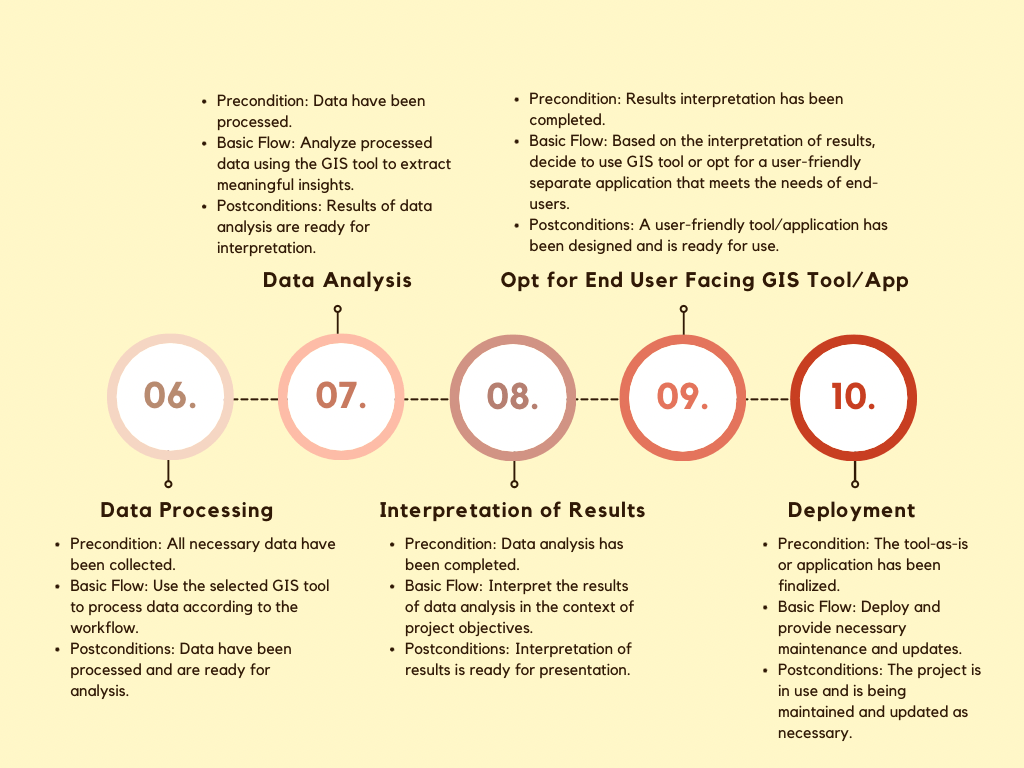
The purpose of this case study is to apply the workflow/worksheet approach mentioned in a previous post to a real-life scenario in the field of municipal finance, specifically focusing on the collection of property taxes using Geographic Information Systems (GIS). GIS technology plays a crucial role in accurately assessing and determining the value of properties within a particular jurisdiction, ensuring a fair distribution of the tax burden among property owners. By integrating GIS data with property tax systems, governments can enhance the accuracy, efficiency, and transparency of the property tax assessment and collection process. This integration enables effective analysis and visualization of spatial information, including property boundaries, land use, zoning, and other pertinent data. Such comprehensive analysis allows assessors to precisely identify and evaluate properties, considering location, amenities, proximity to services, and market conditions. In this post, we will follow the ten-step process outlined in the previous post, displayed below.
Reading Time: 30 min.
Emphasizing Open-Source GIS Software: In exploring GIS application development, we pay special attention to open-source GIS software. Here, we'll delve into various open-source GIS tools, highlighting their unique features and uses. In our discourse, these tools may be highlighted in various ways. Sometimes, they'll be featured as standalone bullet points, elaborating on their specific functions and advantages. Other times, their logos may be displayed to enhance recognition and familiarity. Occasionally, they may be mentioned within the text, seamlessly integrated into the discussion, or highlighted in bold for emphasis. We may not follow a consistent pattern in highlighting these tools. Still, one thing is certain: we bring attention to them and explain how they're employed in the process of GIS application development. Open-source GIS tools form the backbone of many successful applications, and understanding their use and implementation is key to creating effective, reliable, and efficient GIS solutions.
In the broad domain of municipal finance, the application of GIS technology serves myriad essential purposes. Examining a single facet in this case study, we focus on the role of GIS in facilitating property valuation and taxation. By considering diverse spatial factors, GIS ensures taxation is calibrated to a property's fair market value. This leads to a more balanced distribution of property taxes among owners, with properties of similar characteristics in comparable locations fairly taxed. GIS technology bolsters efficiency by automating data integration, analysis, and visualization within the tax assessment and collection processes. It reduces manual effort and empowers assessors with spatial data-driven insights. Another benefit is GIS's transparency by visually depicting property data, demystifying tax calculations for property owners, and enabling them to verify the factors used in assessments. Furthermore, GIS assists in effective land management, empowering authorities to monitor land use, record changes, and strategize future developments. Employing GIS for property tax collection is ultimately directed towards instituting a fair and efficient tax assessment and collection system, thereby enhancing accuracy, improving processes, ensuring transparency, and contributing to effective land governance.
STEP#1: Defining the Project Objectives
To develop and implement a Geographic Information System (GIS) that enhances property tax collection efficiency and fairness in less developed countries by improving property valuation, resolving land ownership disputes, and increasing transparency and public awareness.
Problem Definition: The project seeks to address the numerous challenges associated with property tax collection in less developed countries, which include issues with property valuation, informal settlements, poor infrastructure, corruption and inefficiency, lack of capacity and resources, low public awareness and compliance, land ownership disputes, political resistance, lack of a robust legal framework, and instability and conflict.
Stakeholder Needs: (1) Tax authorities need a more efficient and transparent way to value properties and collect taxes; (2) Property owners need a clear and fair system for determining their tax obligations; (3) Informal settlement residents need recognition and regularization of their properties; and (4) The general public needs increased transparency to understand and trust the tax collection process.
Pain Points: (1) Lack of accurate property documentation, (2) Lack of accurate property valuation; (3) Difficulty in taxing informal settlements; (4) Inefficiency and corruption in the tax collection process; (5) Limited capacity and resources for tax collection; and (6) Land ownership disputes hindering the tax collection process.
While we acknowledge that GIS alone cannot fully address the breadth and complexity of the challenges associated with property tax collection in less developed countries, it is crucial to recognize its potential as a significant component of the solution. Therefore, our approach first emphasizes a big-picture understanding of the interconnected issues and then hones in on specific areas where GIS can make a significant difference.
GIS Role: As such, we advocate for a perspective that embraces a comprehensive understanding of the intricately interconnected issues and zeroes in the specific areas where GIS can make a substantial impact. These areas are:
Improving Property Valuation: By providing spatial data about local features and conditions, GIS can contribute to a more accurate and fair assessment of property values, thus ensuring equitable taxation.
Mapping Informal Settlements: GIS can help map informal settlements, providing a clearer picture of the land use patterns. This data can then be utilized to support regularization efforts, paving the way for the inclusion of these areas in the tax net. Also, a lack of spatial data in these areas often leads to exclusion from the formal tax system, perpetuating inequalities.
Increasing Transparency and Efficiency: The ability of GIS to offer visual, easily understandable maps and spatial data can boost transparency in the tax collection process. It also allows for better planning and optimization of resources, thereby increasing efficiency.
Resolving Land Ownership Disputes: By providing accurate maps of property boundaries, GIS can be a powerful tool in resolving disputes over land ownership – a common obstacle in establishing a robust property tax system.
Aiding Public Awareness Campaigns: Visual and spatial data provided by GIS can be harnessed for public awareness campaigns, helping citizens better understand the tax system and their obligations and fostering trust in the process.’
The reality in most GIS projects is that a decent amount of data is usually available, though not all of it is immediately useful. Some of this data can be utilized as is, some may require modifications to become useful, and some might be completely irrelevant or useless for the project. Moreover, additional data must be obtained from remote sensing or mapping providers—which will likely require further processing. Further, some data must be locally sourced and mapped in the field or on-site. If fortunate, one might stumble upon existing data collected by previous employees, other teams, or organizations that might relate to the project. Such diverse and scattered data makes it particularly challenging, especially in developing countries. As a result, data identification and collection steps are sometimes considered the most difficult and demanding aspects of GIS projects.
STEP#2: Identifying Data Requirements
Data must be identified and collected for all relevant spatial and non-spatial data for a parcel level of interest. Spatial data might include the boundaries of the parcels, which can often be obtained from one entity in the local government and, in some cases, driven from recent satellite imagery. Non-spatial data could include property characteristics like the age of structures, building materials, square footage, and so forth, often found in property tax records. Let's break down the types of data you might need to collect for a comprehensive property valuation:
Understanding the Math Behind the Data: To a significant extent, GIS workflows are often constructed around the mathematical models or computational algorithms describing the problem being tackled. GIS-based problems often involve data analysis, spatial statistics, simulations, and other computations, all inherently mathematical. Local government bodies typically determine property tax, and the exact method can vary by jurisdiction, but in general, it involves three primary steps or a variation of them. First, a property assessment is conducted to determine the property's market value, which considers the property's size, age, location, improvements or modifications, and prices of similar recently sold properties in the area. Second, the local government sets the tax rate based on how much revenue it needs to raise through property taxes to cover its budget, dividing this total budget by the taxable assessed value of all properties within its jurisdiction. Finally, the property tax is calculated by multiplying the property's assessed value by the tax rate. For example, if a property valued at $300,000 has a tax rate of 1.2%, the annual property tax would be $3,600. Other considerations, such as exemptions, abatements, and deductions, might lower a property's taxable value, thereby reducing the property tax. However, specific processes and factors involved in calculating property taxes can greatly vary, so checking with the local tax assessor's office or a local real estate professional for accurate information is crucial.
Property assessment: The methods vary by jurisdiction, but three primary methods are commonly used. First, the market approach values a property based on what similar properties have sold for in the same area, considering the property's location, size, condition, and features and the prices at which similar properties have recently sold. Second, the cost approach, often used for unique or special-purpose properties or new construction, values a property based on how much it would cost to replace it with an identical or similar property, taking into account the cost of materials and labor required to reproduce or replace the property, minus depreciation. Lastly, the income approach, typically used for investment or commercial properties, values a property based on its income. It calculates the net present value of future income streams given the yield an investor would expect for that investment. Depending on the property's nature and data availability, these methods can sometimes be combined. However, the specifics can vary greatly depending on local laws and practices, so it's best to contact the local assessor's office for the most accurate information. Each method would require different data collection: Each method of property assessment requires specific types of information or measurements to complete the evaluation:
Market Approach: For the market approach, the following measurements are typically required:
The recent sale prices of comparable properties in the same area.
Characteristics of the property, including the number of bedrooms and bathrooms, square footage, lot size, age, and the property's condition.
Cost Approach: For the cost approach, these measurements are needed:
The cost to construct a similar property, including labor and materials. This might require data on local construction costs and labor rates.
The value of the land as if it were vacant. This could be based on the sale prices of comparable land parcels in the same area.
The depreciation of the property could be due to physical wear and tear, functional obsolescence (e.g., an outdated layout), or external factors (e.g., changes in the neighborhood).
Income Approach: For the income approach, you would need:
The potential income the property could generate. For rental properties, this would be the potential rental income. For businesses, it could be the income the business generates.
The operating expenses of the property, such as maintenance, utilities, insurance, and property management costs.
The capitalization rate is the rate of return a reasonable investor would expect on the property type. This could be based on rates for comparable properties.
Data Type #1—Spatial Data—these data have a geographic component and are important for property valuation. Usually, they can be generated through GIS tools if not already available.
Parcel Boundaries: These are the specific outlines of each property. They typically come in the form of shapefiles and indicate the precise geographical boundaries of a property.
Future Development Plans: Information about any future infrastructure or development plans in the area. These could significantly impact the future value of a property.
Satellite Images: High-resolution satellite images can provide a lot of useful information about a property, including the size and shape of buildings, the presence of features like pools or solar panels, and the general condition of the property.
Topographic Data: This could include Digital Elevation Models (DEMs) that show the elevation of the land, which could affect property value.
Land Use Data: This shows how land in the area is used (residential, commercial, industrial, agricultural, etc.). Land use could have a significant impact on property values.
Road Networks: Proximity to transportation infrastructure can influence a property's value. This includes public transit data stations or stops, and proximity to public transportation can be a significant factor in property valuation.
Environmental Data: This might include flood zones, proximity to bodies of water, forest cover, soil quality, etc.
Amenities: Locations of schools, parks, shopping centers, hospitals, and other amenities.
Data Type #2—Non-Spatial Data—these are data that don't have a geographic component but are still important for property valuation:
Structural Characteristics: This might include the age of the buildings, their square footage, the number of rooms, the types of materials used, and other physical characteristics.
Building Codes Compliance: Details about the building's compliance with local codes can impact its value. This could include information about any code violations and the results of any inspections.
Rental History: If a property has been rented out in the past, information about the rental history can be useful. This could include the length of each rental period, the amount of rent charged, and the reliability of the tenants.
Ownership Details: This might include the owner's name, purchase date, purchase price, etc.
Sale History: Information about previous property sales, including dates and prices.
Tax Records: Past tax assessments and payments could be useful for predicting future tax amounts.
Local Market Data: Data about recent sales of comparable properties in the area.
Zoning Regulations: The property's zoning designation and what kind of structures or businesses are allowed there.
Environmental Efficiency Ratings: These can include ratings related to energy efficiency, such as LEED ratings or other environmental impacts of the property.
Disaster History: Information about any natural disasters that have affected the property. This could include floods, earthquakes, wildfires, etc.
Crime Statistics: Detailed data about the area's prevalence and types of crime can significantly impact a property's value.
Liens and Judgments: Any liens or judgments against the property could affect its marketability and value.
The above data list is expansive, and not all taxation authorities or related laws necessitate every type of data. This comprehensive list aims to illuminate the wide array of data required for a GIS solution in what might initially seem like a straightforward property tax scenario. The jurisdiction and its governing laws ultimately determine the data that needs to be collected and its utilization based on the chosen property valuation method and the specifics of tax law.
When collecting data, ensuring ISO or INSPIRE compliance for data can be important for interoperability, standardization, and data sharing. While it's crucial to consult the specific requirements of ISO or INSPIRE for your region or project, here are some general considerations for data formats and importing into open-source GIS software like QGIS.
Spatial Data Infrastructure (SDI) Considerations—ISO (International Organization for Standardization) standards play a critical role in guiding the creation and management of Spatial Data Infrastructure (SDI). Here's how the data could be formulated with references to relevant ISO standards:
Data Availability (ISO 19115: Metadata): According to this standard, there should be adequate metadata to describe the available spatial data for the required geographic areas. This ensures that users can find the appropriate datasets and understand their content, source, and usability.
Data Accuracy (ISO 19157: Data Quality): This standard provides a framework for specifying and reporting data quality, including accuracy. The SDI will ensure the spatial data is accurate and up-to-date, with quality measures implemented according to this standard.
Interoperability (ISO 19119: Services): This standard defines how GIS and ‘services’ interact. This assumes that there is an ambition to integrate with other systems used by tax authorities, for example—in such cases, the data can integrate effectively with other systems used by tax authorities, promoting seamless data sharing and usage.
Sustainability (ISO 19101: Reference Model): This standard provides a framework for establishing and maintaining an SDI. It will guide the project in ensuring the system is robust, maintained, and updated over time to remain relevant and useful.
Spatial Data Infrastructures (SDIs) are frameworks of spatial data, metadata, users, and tools that are interactively connected to deliver spatially related information efficiently to users in diverse settings. The use of schematic mapping and schema in this context is pivotal for a variety of reasons, three of which we'll delve into shortly. But first, let's understand the nuances of schematic mapping of existing data, periodic reports, and scheme of service.
Schematic Mapping of Existing Data: This process entails visualizing or representing existing spatial data in an organized, intuitive, and easily understandable format. This can include various geographic and spatial data an organization may have collected over time. It provides an overview of the current data situation and can help to identify patterns, relationships, or discrepancies that might not be readily apparent from raw data.
Schematic Mapping of Periodic Reports: Periodic reports contain valuable insights into temporal changes, trends, and patterns. Schematic mapping of such reports visually represents these insights over time, often revealing otherwise hidden temporal patterns or changes. This makes it easier for decision-makers to understand trends and make informed decisions.
Schematic Mapping of Scheme of Service of Selected Institutions: This pertains to the visual representation of how different services of an organization or institutions are interconnected spatially, how they function, and how they can influence one another. In an SDI context, it can map the flow of spatial data within and between organizations, highlighting any bottlenecks, inefficiencies, or potential areas for improvement.
Now, let's explore why schemas and schematic mapping are crucial in three different contexts:
In General: First, they ensure data consistency, as they enforce a specific structure and standard, which, in turn, leads to reliable, quality data. Second, they aid in data interpretation and analysis. With consistent and well-structured data, users can effectively make sense of the information. Lastly, they allow for improved data management, making it easier to store, retrieve, update, and delete data as necessary.
For an Individual Organization: Schemas and schematic mapping can significantly boost decision-making capabilities. They provide a clear and comprehensive view of the data, enabling the organization to identify trends, patterns, and insights. Additionally, they enhance data quality and integrity within the organization, ensuring data standards are met. Lastly, they improve efficiency by providing a structured approach to managing large volumes of spatial data.
For Several Organizations Working Together: Collaborative initiatives can greatly benefit from schemas and schematic mapping. First, they facilitate interoperability, ensuring diverse datasets from various organizations can be integrated seamlessly. Second, they provide a common understanding or 'language,' allowing different organizations to work together more efficiently. Lastly, they enable data sharing and reuse, reducing duplication and enhancing the overall effectiveness of spatial data management.
These ISO standards discussed above are essential guidelines for managing and utilizing spatial data, which significantly relate to schematic mapping. ISO 19115 underscores the necessity of metadata in facilitating the discovery, understanding, and utilization of datasets - an underlying principle of schematic mapping. ISO 19157 emphasizes the quality of spatial data, particularly its accuracy, which schematic mapping inherently relies upon to provide accurate visual representations. ISO 19119 points to interoperability, an essential aspect that schematic mapping contributes to, as it enables the integration and synthesis of diverse datasets across systems. Finally, ISO 19101 underscores the sustainability of the Spatial Data Infrastructure (SDI), a principle that echoes schematic mapping's role in supporting data management over time through a structured visual approach. Thus, these standards encapsulate the principles and goals of schematic mapping in managing and making effective use of spatial data.
STEP#4: Selecting the GIS Software Tool (Open-Source)
Our decision to utilize open-source Geographic Information System (GIS) software necessitates a minor deviation from the conventional flow diagram, leading us to start with STEP#4 instead of STEP#3. The first step involves selecting appropriate tools among several available open-source GIS software, each endowed with unique features and advantages. Key considerations for open-source software utilization include (1) clearly defining software dependencies and versions within the workflow; (2) planning for potential compatibility and integration challenges with open-source tools; (3) conducting thorough testing of the integration of diverse open-source software components; (4) staying updated with the latest versions of open-source software and adjusting the workflow accordingly; (5) ensuring quality control and reproducibility within the workflow to accommodate changes in open-source software; and utilizing a detailed workflow to communicate with the open-source community when seeking assistance effectively. By incorporating these considerations, the workflow becomes more robust, accommodating open-source software's unique challenges and characteristics. This enhances efficient planning, resource allocation, problem detection, and issue communication, ensuring the smooth and successful operation of the GIS project.
SOFTWARE#1: QGIS—Desktop Geographic Information System (GIS) Software/Editing and Manipulating Geospatial Data: QGIS is a free and open-source GIS software that provides data viewing, editing, and analysis capabilities. It could be used to ingest and analyze the spatial and non-spatial data mentioned above and provide outputs such as property boundary and value maps. If the needs are relatively simple—the datasets are not overly large, QGIS can operate without adding a specific database solution (like PostGIS). However, it's worth noting that the combination of QGIS and PostGIS can offer significant advantages for more complex use cases, as they integrate well together, and the database capabilities of PostGIS can enhance the data handling and processing capabilities of QGIS.
QGIS Plugins—Desktop Geographic Information System (GIS) Software: QGIS has many plugins, tools, and algorithms for spatial data processing and analysis. While QGIS plugins might not be mentioned as a separate software category from QGIS, they play a crucial role in enhancing its functionality. In the context of the problem definition, we are analyzing property areas and calculating taxes and values, so several QGIS plugins can prove highly useful. These include MMQGIS, a plugin providing geocoding tools (by address or by latitude/longitude) and heat map creation, beneficial for linking property addresses to geographic locations. The RefFunctions plugin adds functions usable within the field calculator or the expression engine, making it easier to reference attributes from other layers when calculating property tax based on the property area and the tax rate of the respective jurisdiction. Statist, another plugin, enables basic statistical analysis within QGIS, useful for analyzing property values across an area or region. Group Stats helps generate statistics from a layer based on groupings, such as calculating total property values for different neighborhoods. Additionally, Zonal Statistics, a built-in QGIS tool, allows for analyzing a raster layer's results within the boundaries of a vector layer, a critical feature when dealing with raster data related to property values, like land cover or proximity to specific features. The specific plugins and tools required heavily depend on the data specifics. Community contributors primarily create these plugins, so their continued development, functionality, and compatibility with the latest QGIS version may vary. Thus, testing plugins with your data before incorporating them into critical tasks is advisable.
QGIS is a standalone GIS software that does not require a database solution like PostGIS to operate. You can use it to view, analyze, and edit geospatial data from various sources, including shapefiles, GeoTIFFs, and many other file formats. PostGIS is useful if you need a relational database system to manage and query your spatial data. It adds robust spatial capabilities to the PostgreSQL database, allowing it to store and process geospatial data types. The expectation here is that we will be dealing with large property datasets—for a full country or even a country which will come with complex spatial queries and will need to share the data across a network of other users, and this is why adding a PostGIS database is a good solution.
SOFTWARE#2: PostGIS—Database Extension for Spatial Data: PostGIS is an extension of the PostgreSQL database management system that adds support for spatial objects. It enables geospatial data storage, retrieval, and analysis within a robust database management system. Maybe some background is important here for context. PostgreSQL is often used in conjunction with its spatial database extender, PostGIS. PostGIS adds support for geographic objects to the PostgreSQL database, allowing it to be used as a backend spatial database for GIS. PostGIS adheres to the Simple Features for SQL specification from the Open Geospatial Consortium (OGC) and extends PostgreSQL by introducing new data types such as geometry and geography, thereby enabling the storage of geospatial data, including points, lines, polygons, multi-points, and multi-polygons. This combination of PostgreSQL and PostGIS offers spatial indexing for high-performance searches on geographic objects, allows complex geospatial queries like identifying polygon intersections or finding the closest data points to a specific location, ensures compatibility with other GIS software such as QGIS and GeoServer along with commercial solutions like ArcGIS due to its adherence to the OGC standard, and leverages PostgreSQL's scalability and speed to handle large GIS datasets effectively.
PostgreSQL—Object-Relational Database Management System (ORDBMS): People often confuse PostGIS and PostgreSQL. To simplify this in layman's terms, they are like a phone and a phone app. PostgreSQL is like your phone, a powerful tool for many tasks. It's a database system that allows you to store, manage, and retrieve data efficiently. On the other hand, PostGIS is like an app on your phone; it adds specific new functions to PostgreSQL, specifically functions related to managing geospatial data. Just as you can use a phone without specific apps, you can use PostgreSQL without PostGIS but not the opposite. But, just as certain apps can make your phone much more useful for certain tasks, using PostGIS with PostgreSQL can make it much more powerful for handling geospatial data. As an ORDBMS, it's a powerful, open-source database system that supports SQL (relational) and JSON (non-relational) querying. It is highly extensible and enables structured data storage, retrieval, and manipulation. It's known for its robustness, advanced features, and strong compliance standards.
Early on, it must be determined whether there is an intent to publish maps in web/mobile format—public or private. This decision depends on multiple factors, including the sensitivity of the data, the privacy laws, and the intended audience. Publicly available maps enhance transparency and foster citizen engagement. For instance, distribution maps of public amenities, land use maps, and generalized property valuation maps can be publicly published, enabling citizens to comprehend how tax values are determined and the allocation of public services. Conversely, maps with sensitive data, such as specific property valuation maps linked to individual tax information, detailed property boundaries involving disputes, or maps of informal settlements, should be kept for internal web-governmental use to respect privacy concerns and prevent misuse. Striking a careful balance between transparency and privacy is crucial, with constant vigilance to ensure published maps do not catalyze unintended negative consequences such as stigmatization or gentrification. If maps are publicly published on the web, or restricted access, a GIS web publishing tool will be needed.
SOFTWARE#3: GeoServer or MapServer—Geospatial Server-Side Web/Mobile Map Publishing Software: GeoServer and MapServer are server-side software for publishing geospatial data as web/mobile services. They can serve geospatial data in various formats, such as WMS, WFS, and WCS. They provide similar functionalities but have different implementations and configurations. GeoServer is a Java-based open-source server that allows publishing of geospatial data and services using open standards. It supports various geospatial data formats and provides functionality for serving maps, data visualization, and spatial analysis. GeoServer can publish building permit data, zoning maps, and other spatial information relevant to the project. It offers capabilities for styling, querying, and interacting with geospatial data through standard protocols like Web Map Service (WMS) and Web Feature Service (WFS). MapServer is another open-source web mapping software written in C, and it provides similar functionalities as GeoServer. It allows for creating dynamic maps from various data sources and offers flexible customization options. MapServer supports various spatial data formats and can be used to publish maps and data related to building permits, zoning regulations, and other relevant geospatial information. It supports protocols like WMS and Web Map Tile Service (WMTS) for serving map imagery and can be integrated with web applications to enable interactive map functionality. A few things are very important to clarify about using them:
Server-Machiness: GeoServer or MapServer, as software, are considered "servers” or server machines—running on dedicated computers or cloud-based that handle requests for geospatial data. Imagine you have a map application on your phone or desktop. When you ask it to show you all the informal parcels in a certain area, the application sends that request to a server. The server then processes this request, finds the information, prepares a map with all the specific parcels, and sends it back to your phone or desktop.
Desktop and Mobile Platforms-Support: GeoServer and MapServer handle requests for data and serve it out to other systems or applications. These servers process geospatial data and make it available for consumption by various clients. The client applications, which consume the data served by GeoServer or MapServer, can be either desktop or mobile applications. These can be applications like a web-based map viewer running in a browser on a desktop computer or a mapping application on a mobile device. So, while GeoServer and MapServer are not directly intended for use on desktop or mobile in the traditional sense, the data they serve can be consumed and displayed by applications running on these platforms. Therefore, in a broader sense, you could say that GeoServer and MapServer indirectly support both desktop and mobile platforms by serving data to applications running on these platforms.
You just really need one! Yes, it's possible to use both GeoServer and MapServer simultaneously, but not to run them concurrently on the same data in the same process. Rather, you could have both servers installed on your system and switch between them as needed or use each for different projects or parts of a project. They have different features, interfaces, and performance characteristics, so you might choose to use one or the other depending on your specific needs. You could also have both servers access the same underlying data source (a PostGIS database) simultaneously, but they would provide separate services. They would not be interacting with each other directly. Also, running multiple servers simultaneously can increase the load on the system and slow things down.
APIs: GeoServer provides APIs allowing to interact with its functionalities programmatically. These APIs enable tasks such as managing data stores, publishing layers, configuring styling, and performing spatial queries. Developers can use the RESTful API provided by GeoServer to access and manipulate geospatial data and services. Simimililary, MapServer does provide an API called the MapScript API. MapScript is a set of programming language bindings that allow developers to interact with MapServer's functionality and services programmatically. The full-stack development process in GIS often involves integrating with server-side APIs and services to fetch geospatial data and perform dynamic updates. This requires a solid understanding of web protocols, RESTful APIs, and data formats like GeoJSON or WMS/WFS for seamless data communication between the client and server.
Limitations: GeoServer or MapServer primarily excels in the following areas: (1) Serving geospatial data: they can serve geospatial data over the web using open standards like Web Map Service (WMS), Web Feature Service (WFS), Web Coverage Service (WCS), and others—it can translate your data into various formats like GeoJSON, KML, GML, and more; (2) Styling maps: they allow you to style your maps using Styled Layer Descriptors (SLD) and CSS, and (3) Integrating with web-based GIS tools: They are used in conjunction with frontend web mapping libraries like OpenLayers, Leaflet, and others to display data in an interactive and user-friendly format. They are not intended for back-end coding when you need data processing, geometric transformations, projection, data analysis, advanced geospatial analysis, raster analysis, or integration with data science and machine learning libraries—for this; you must dig into back-end coding, meaning python or like.
You Need a Visualization Solution on the Client Side: You need a client application to visualize and interact with the geospatial data served by GeoServer or MapServer on a desktop or mobile device. These applications could be web-based or standalone apps. A wide range depends on the project requirements and the intended use. The client applications, which consume the data served by GeoServer or MapServer, can be either desktop or mobile applications. These can be applications like a web-based map viewer running in a browser on a desktop computer or a mapping application on a mobile device. So, while GeoServer and MapServer are not directly intended for use on desktop or mobile—as we emphasized a few times already! in the traditional sense, the data they serve can be consumed and displayed by applications running on a ‘whatever’ platform. All you need is a client-side solution to communicate, capture and display the data on the client side.
When you do not need a Geoserver? Direct integration with services like Google Maps or OpenStreetMap might be more appropriate for simpler mapping or geolocation functionality.
On the server side—processing, managing, and serving the geospatial data in open-source GIS, development often seems more straightforward than visualization on the front end, especially when presenting the client with appealing and interactive visualizations and applications. Open-source GIS GeoServer or MapServer simplifies the necessary infrastructure to serve geospatial data to the client and leverages powerful tools like PostGIS for spatial database management. These tools adhere to open standards and provide robust functionalities for handling spatial data, making it relatively straightforward for developers to implement server-side GIS solutions. This contrast can be seen as a deviation from the general norms of ‘coding,’ where back-end development tends to be more complex than front-end development. We explore quite a few options with varying complexities for how to deliver front-end solutions.
SOFTWARE#4: Geospatial Client-Side, Front-End Visualization Software: In the context of GIS, the term "front end" refers to the user-facing aspect of a client application, where a map is visualized and made interactive for the client, allowing users to explore, analyze, and interact with the information. In contrast, the server side of open-source GIS primarily deals with the back end; many consider front-end development for GIS applications as requiring additional considerations, as it involves translating the complex geospatial data into visually appealing and interactive representations for the end-user. This includes designing intuitive user interfaces, implementing map interactions, and incorporating features like searching, filtering, and data exploration. Additionally, the front-end development process must consider factors like performance optimization, responsiveness across different devices, and compatibility with various web browsers. Complexity also arises from the availability of various options to approach this, which we will discuss in the context of a specific example project:
Client-Side Web Mapping Libraries: Client-Side Web Mapping Libraries are powerful tools to create interactive maps directly in web browsers. These libraries, such as OpenLayers, Leaflet, and Mapbox GL JS—are all primary web mapping libraries designed to create interactive maps that can be displayed and interacted with in web browsers, provide various functionalities to render maps, overlay data layers, and enable user interactions. For example, you can use OpenLayers to display a base map from GeoServer or MapServer and overlay additional layers served by those servers. By fetching the necessary geospatial data from a server, these libraries can create dynamic and interactive maps that users can zoom in, zoom out, click on, and explore. GeoServer or MapServer can publish geospatial data, such as shapefiles or GeoTIFFs, and serve them to the client-side web mapping libraries. These server-side software applications are the data source, hosting the spatial data and providing access through standardized protocols like WMS (Web Map Service) or WMTS (Web Map Tile Service). When configured to request data from GeoServer or MapServer, the web mapping library can dynamically retrieve the desired geospatial data and display it on the client-side map. In municipal finance or urban planning context, client-side web mapping libraries can be utilized to visualize various spatial datasets. For example, display property parcels, zoning information, infrastructure networks, and demographic data on interactive maps. Client-side web mapping libraries retrieve geospatial data from servers, including GeoServer or MapServer. These servers can host spatial datasets and provide web services for data distribution. Integrating client-side libraries with GeoServer, MapServer, municipal finance, or urban planning. For example, OpenLayers can utilize GeoServer as the backend for storing and serving property tax assessment data. The OpenLayers library can retrieve this data from GeoServer and visualize it on a web map. Government officials can interact with the map to explore property values, tax rates, and related information, facilitating efficient property assessment, tax calculation, and collection processes.
Let’s take a Leaflet deep-dive because it’s important! Of the various geospatial web mapping libraries—tools for interactive web-based Mapping, Leaflet stands out for creating dynamic and interactive web maps. Leaflet offers a lightweight, flexible solution with a simple, intuitive API that easily integrates maps into web pages. Its library supports many base maps, including OpenStreetMap, Mapbox, and various tile providers—you can choose the most suitable base map for the application or create custom base maps to match the specific visual style or thematic focus. The map tiles are the small square images that make up a map that is pre-rendered on servers, and when you fetch data for an application, the map tiles are fetched from the tile provider's server and displayed on your screen. One of the key features of Leaflet is its support for various layers and overlays. You can overlay custom markers, polygons, polylines, and other elements onto the map, allowing for the visualization of geospatial data meaningfully. Additionally, Leaflet provides interactive controls, such as zooming, panning, and user interactions, enabling users to explore and interact with the map seamlessly. Leaflet supports geospatial data formats, including GeoJSON, KML, and WMS—this allows them to incorporate geospatial datasets into their web maps easily. It also provides capabilities for handling geospatial data on the client side, such as spatial queries and filtering, empowering a dynamic and responsive mapping application. Another notable feature of Leaflet is its extensive plugin ecosystem—there is a vast collection of plugins to enhance the functionality of the web maps it can produce. These plugins offer additional features like clustering, heatmaps, geocoding, and routing. The plugin system enables to extend the capabilities of Leaflet and tailors the map functionality to specific application requirements. Leaflet is not made primarily for mobile but is designed to be mobile-friendly—responsive design across different devices and screen sizes. Compared to other open-source options, its simplicity, flexibility, extensive plugin ecosystem, and mobile friendliness make it the ideal choice for applications that need to be mobile or target a wide range of devices.
Mobile Geospatial Software Toolkits (SDKs): Mobile geospatial software development toolkits, such as Mapbox and ESRI mobile SDKs, provide developers with the necessary resources to create geospatial applications specifically designed for mobile devices. These SDKs offer pre-built functionality, APIs, and user interface components tailored for mobile platforms. Developers can utilize these toolkits to build applications that leverage geolocation, mapping, and data visualization capabilities. Mobile geospatial software can enable field data collection, inspection, and reporting in municipal finance or urban planning. For instance, urban planners can use a mobile application built with Mapbox or ESRI SDKs to conduct surveys on-site, assess infrastructure conditions, collect property information, and update planning data in real time. This streamlines data collection processes and improves the accuracy and efficiency of urban planning tasks. Mobile geospatial applications can integrate with GeoServer or MapServer to access and synchronize geospatial data between mobile devices and server-side repositories. This allows mobile applications to fetch and update data in real time, ensuring that field-collected information is immediately available for analysis and decision-making. For example, a Mapbox SDK can connect to a MapServer instance that hosts geospatial data related to infrastructure assets and land-use planning. The application can display map layers from MapServer, such as roads, buildings, and utility networks, and allow planners to perform on-site assessments, capture data, and update attributes. These changes can be synchronized with the MapServer, ensuring data consistency across different platforms. While Mapbox does provide an open-source option for their mobile SDKs, it's important to note that ESRI's mobile SDKs are not open-source. Mapbox offers the Mapbox Maps SDK for Android and Mapbox Maps SDK for iOS as open-source options, allowing geospatial applications for mobile platforms to be built using their tools and resources at no cost. By utilizing the open-source Mapbox SDKs, you can leverage the functionalities provided by Mapbox, such as interactive maps, geolocation services, and data visualization capabilities, to create customized mobile geospatial applications. These SDKs offer flexibility and extensibility, enabling developers to incorporate mapping and location-based features into their applications.
Web Framework Extensions for Geospatial Data: Open-source web framework extensions, like GeoDjango for the Django (primarily web) framework, enhance web development frameworks with geospatial capabilities. These extensions provide additional tools, APIs, and database integration for handling, processing, and displaying geospatial data within web applications. They simplify the development process and enable efficient management of spatial datasets. In municipal finance or urban planning, web framework extensions for geospatial data facilitate the creation of web-based applications for data entry, analysis, and visualization. For instance, a municipal finance application built with GeoDjango can store and manage property tax assessment data, enabling users to search, query, and visualize property values, tax rates, and related information. These applications can provide intuitive interfaces for accessing spatial data, performing geospatial analysis, and generating reports. Web framework extensions can integrate with GeoServer or MapServer to access and serve geospatial data. They can leverage the server-side capabilities of GeoServer or MapServer to store and retrieve spatial datasets, provide geospatial web services, and handle data synchronization between the web application and server repositories. For example, GeoDjango can use GeoServer as the backend for storing and serving geospatial datasets, such as land parcels, transportation networks, and environmental data. The application can leverage GeoDjango's capabilities to query, analyze, and visualize this data, presenting maps and related information.
Geospatial Business Intelligence (BI) Tools: They specialize in software solutions that enable visualization, analysis, and derive insights from geospatial data. These tools provide advanced mapping and visualization capabilities, allowing users to create interactive dashboards, reports, and visualizations incorporating geographic elements. Geospatial BI tools combine spatial data with other data sources, enabling spatial analysis and other data decision-making to take place together. For example, a city government tax official can analyze property tax revenues, compare property values across different areas, identify trends or patterns in urban development, and create interactive maps and reports for public transparency and decision support. Geospatial BI tools can integrate with GeoServer or MapServer to access and incorporate geospatial data into their analysis and visualizations. These tools can connect to server-side repositories to retrieve spatial datasets, perform spatial queries, and generate visual representations of the data. There are open-source alternatives in addition to commercial tools like Tableau and Power BI (leaders of this category). These open-source options provide cost-effective solutions for visualizing and analyzing geospatial data. Two notable open-source Geospatial BI tools are Metabase and Apache Superset. First, Metabase. Metabase is an open-source business intelligence and analytics tool that supports geospatial data visualization. It offers a user-friendly interface for exploring data and creating interactive dashboards. Metabase allows users to connect to various data sources, including spatial databases like PostGIS, and generate maps and charts based on geospatial data. While Metabase's geospatial capabilities are not as extensive as some commercial tools, it provides a solid foundation for organizations seeking open-source Geospatial BI solutions. For example, an urban planning department can use Metabase to analyze property tax revenues by connecting it to a GeoServer instance hosting spatial data related to tax assessments and property boundaries. Metabase can fetch geospatial data from GeoServer, perform spatial analysis and aggregations, and generate interactive maps and dashboards displaying tax revenue distribution across different areas. This integration enables the department to gain valuable insights into revenue patterns, identify areas with potential revenue growth, and make data-driven decisions for urban planning initiatives. Second, Apache Superset. Apache Superset is an open-source data exploration and visualization platform with geospatial visualization capabilities. It supports connecting to various data sources and provides an intuitive interface for creating interactive dashboards, charts, and maps. Apache Superset can leverage spatial databases like PostGIS to work with geospatial data and generate map-based visualizations. With its extensible architecture and active community, Apache Superset offers flexibility and customization options for organizations seeking open-source Geospatial BI tools.
Output maps’ visualization is crucial and carries a broad dissemination objective for stakeholders. To offer spatial information as services to citizens, interactive maps will require a client-side mobile or desktop solution to render them on the citizen’s device. However, if, for instance, a tax authority department merely needs to manage its map records and generate accurate reports spatially and effectively, everything can be handled desktop and within the open-source QGIS software without additional bells and whistles. You can simply rely on the GIS desktop software alone if there's no requirement for field data entry necessities, elaborate web-based or mobile applications, or extensive access to the map by a broad audience.
SOFTWARE#5: Geospatial Back-End Computing/Code Libraries: When you need to perform computing on the backend, you need to access software libraries that provide a collection of functions, algorithms, and tools for performing advanced analysis and processing of geospatial data and enabling complex spatial modeling. As discussed earlier, open-source libraries for frontend, web-based mapping, and visualization, you can use Leaflet.js: OpenLayers and Mapbox GL JS—tools to display geospatial data in a graphical, interactive format on the client side, and while GeoServer is excellent for serving and styling geospatial data and integrating with web-based mapping tools, it is limited in manipulating, analyzing, and processing geospatial data. As needed, you need back-end computing libraries for (1) Data processing and manipulation: These libraries provide more advanced capabilities for manipulating and processing geospatial data. They allow for operations such as spatial joins, geometric transformations, reprojection, and much more; (2) Data analysis: They provide tools for advanced geospatial analysis. This can include spatial statistics, network analysis, raster analysis, etc.; and (3) Integration with data science and machine learning libraries: Some libraries combine geospatial analysis with more traditional forms of data analysis and machine learning. There is quite a wide field of open-source options, so we will try to make it quick and concise by focusing on the most used:
PostGIS: You are correct that we said PostGIS is an extension of the PostgreSQL database management system. While primarily a spatial database, "computing" may not accurately describe its functionality. PostGIS is designed to enhance PostgreSQL with geospatial capabilities, allowing it to efficiently store, manage, and query geospatial data. However, since it adds spatial data types, indexing, spatial functions, and spatial query optimization to PostgreSQL, enabling complex geospatial computations within a database environment. In the context of geospatial analysis libraries, PostGIS is often considered a ‘back-end computing’ option due to its robust spatial querying capabilities, allowing users to perform advanced spatial analysis directly within the database. It facilitates tasks such as spatial joins, proximity searches, and spatial operations like buffering and overlay analysis.
GeoPandas: GeoPandas is an open-source geospatial analysis library built on top of the popular Pandas library in Python. It extends Pandas functionality by supporting spatial data structures and operations. GeoPandas allows users to work with geospatial data in a tabular format, where each row represents a geographic feature and includes attributes and geometric information. With GeoPandas, users can read and write geospatial data in different formats, such as shapefiles, GeoJSON, and geospatial databases. The library provides various spatial operations and functions, including spatial joins, buffering, overlay analysis, and geometric manipulations. These operations allow users to conduct spatial analysis, query data based on location or attributes, and perform geospatial computations. GeoPandas also integrates with other Python libraries such as NumPy, Matplotlib, and scikit-learn, enabling users to combine geospatial analysis with other data analysis and machine learning tasks. The library provides powerful visualization capabilities, allowing users to create maps and plots directly from their geospatial data. Regarding interaction with other technologies, GeoPandas can work seamlessly with PostGIS. Users can read and write data between GeoPandas and PostGIS, perform spatial queries, and leverage PostGIS's spatial indexing and analysis functionalities. GeoPandas can also be integrated with web mapping servers like GeoServer and MapServer, which allow users to serve geospatial data over the web. Users can extract data from GeoPandas, convert it to a format compatible with GeoServer or MapServer, and publish it for web-based visualization and analysis. Furthermore, GeoPandas can interact with QGIS—users can import GeoPandas DataFrames into QGIS as layers, enabling them to leverage QGIS's extensive geospatial analysis and visualization functionalities. The bidirectional interaction between GeoPandas and QGIS facilitates data exchange and supports comprehensive geospatial analysis workflows. Additionally, GeoPandas can work with Leaflet for interactive web mapping. GeoPandas can export geospatial data to formats compatible with Leaflet, such as GeoJSON, allowing users to visualize and interact with their geospatial data on web maps created using Leaflet. In summary, GeoPandas is an open-source geospatial analysis library that provides powerful tools for working with geospatial data in Python. Its integration with PostGIS, GeoServer, MapServer, QGIS, and Leaflet makes it usually the first option if there is a need for ‘heavy lifting’ computation on the backend.
GDAL (Geospatial Data Abstraction Library)/OGR (Simple Features Library)—Library for Geospatial Data Translation: They are powerful and widely used open-source libraries for geospatial data formats. GDAL focuses on raster data (gridded or continuous data), while OGR specializes in vector data (points, lines, and polygons). GDAL/OGR provides extensive support for reading and writing various geospatial data formats, including popular formats like GeoTIFF, Shapefile, KML, etc. These libraries enable users to access and manipulate geospatial data from different sources, making it possible to convert between formats, extract subsets of data, and merge or mosaic datasets. One of the key strengths of GDAL/OGR is its ability to perform geospatial transformations. It supports coordinate system conversions, reprojections, and georeferencing, allowing users to align data from different sources or project it into different coordinate systems. This capability is crucial for ensuring data interoperability and accurate spatial analysis. GDAL/OGR also offers various data analysis and processing functions. For raster data, it provides capabilities such as resampling, mosaicking, and warping. Users can perform calculations, apply filters, or extract specific regions of interest within raster datasets. Regarding vector data, GDAL/OGR supports geometric operations like buffering, simplification, and overlay analysis. These operations enable users to conduct spatial analysis, query data, and derive new information from geospatial datasets. Moreover, GDAL/OGR integrates with other geospatial tools and libraries, making it a versatile component in geospatial workflows. It can be used with libraries like GeoPandas and PostGIS, allowing seamless data exchange and analysis. GDAL/OGR can also be utilized within QGIS, providing direct access to data processing and analysis functionality. In summary, GDAL/OGR is a widely adopted geospatial data abstraction library that offers comprehensive capabilities for reading, writing, and manipulating raster and vector geospatial data formats. Overall, GDAL falls under the category of Libraries and is widely used in the geospatial community as a fundamental tool for data interoperability and geospatial data processing. As a library, GDAL is not an editing tool itself. Still, it provides developers with a set of functions and APIs that can be utilized in their geospatial applications and workflows. It enables programmers to integrate geospatial data format support and processing capabilities into their software solutions. Note: They are called Command-Line Geospatial Tools because they perform operations on geospatial data using command-line commands.
Shapely: It is a Python library for geometric operations and manipulations of geospatial data. It provides a set of geometric objects, such as points, lines, and polygons, along with a wide range of operations and functions to analyze and process these geometries. One of the key differences between Shapely and GeoPandas is their data structure and focus. While GeoPandas is built on top of the Pandas library and works with geospatial data in a tabular format, Shapely focuses solely on geometric objects and their manipulation. Shapely provides a convenient and efficient way to create, modify, and analyze individual geometric objects. It allows you to perform operations such as intersection, union, difference, and buffering on geometries. You can also calculate distances, areas, centroids, and other geometric properties using Shapely.
When to use Shapely instead of GeoPandas? (1) Geometric Operations: Shapely is particularly useful when performing complex geometric operations on individual geometries or small sets of geometries. For example, if you want to calculate the intersection between two polygons or buffer a set of points, Shapely provides dedicated functions for these operations; (2) Geometry Manipulation: If your focus is on creating, modifying, or transforming geometries, Shapely offers a rich set of functions for these tasks. You can easily create new geometries, modify existing ones, or transform them using various spatial operations; and (3) Standalone Geometric Analysis: If you're working with geospatial data that doesn't require tabular attributes or a structured DataFrame—a tabular data structure contains rows and columns which can be used to store, analyze, and visualize spatial data. Each column, also known as a field or attribute, represents a particular variable, and each row or record corresponds to a certain geographic feature; Shapely allows you to focus on the geometric aspects solely. It provides a lightweight and efficient solution for geometrical analysis without the overhead of managing tabular data.
When to use GeoPandas instead of Shapely? (1) Tabular Data Analysis: If your geospatial analysis requires extensive attribute data associated with geometries, or if you need to join, filter, or aggregate data based on non-spatial attributes, GeoPandas (built on pandas) is a more suitable choice. It combines the power of tabular data analysis with geospatial functionality; (2) Large-scale Data Management: If you're working with large datasets that require efficient data handling, indexing, and querying, GeoPandas (and pandas) provide optimized data structures and operations specifically designed for large-scale tabular data; and (3) Data Integration and Analysis: If your workflow involves integrating geospatial data with other data sources, conducting statistical analysis, or machine learning tasks alongside geospatial analysis, GeoPandas (and pandas) offer seamless integration with other data analysis libraries in Python. In summary, Shapely is a specialized library for geometric operations and manipulations of geospatial data. It is suitable when focusing primarily on individual geometries and their geometric properties. On the other hand, GeoPandas (and pandas) are more appropriate when working with tabular geospatial data, requiring attribute analysis, large-scale data management, and integration with other data analysis tasks.
SOFTWARE#6: Geocoding Services—Geocoding APIs: GDAL and OGR are not geocoding services. They are libraries for reading, writing, and manipulating geospatial data in various formats, including vector and raster data. While they can be combined with geocoding services, their primary purpose is not geocoding. This brings up the need to sometimes have Geocoding Services (APIs). Geocoding is vital in GIS and digital mapping because it enables a crucial connection between textual address data and geographic coordinates. There are two main APIs: (1) Google Maps Geocoding API: The Google Maps Geocoding API is a critical tool for converting addresses or place names into geographic coordinates; it bridges textual information and the visual world of mapping. Such a service is indispensable when you want to visualize address-based data on a map, making your application more interactive and user-friendly. The API takes an input, an address, or a place name and returns the associated geographic coordinates (latitude and longitude). Conversely, it can also take geographic coordinates and return an address or place name, a process known as reverse geocoding. Though the Google Maps Geocoding API itself is not open-source, its flexibility allows it to be utilized with other open-source geospatial technologies. Integration with platforms such as PostGIS (a spatial database extender for PostgreSQL), GeoServer (a server specializing in sharing geospatial data), QGIS (a professional GIS application), and Leaflet (a mobile-friendly interactive map library) can empower applications to offer sophisticated geospatial features; and (2) OpenCage Geocoder: OpenCage Geocoder is a valuable open-source alternative to the aforementioned API. Its functionality transforms addresses into their equivalent geographic coordinates, facilitating geospatial data visualization on maps. The OpenCage Geocoder provides an API that accepts an address as input and returns the corresponding latitude and longitude coordinates. Like the Google Maps Geocoding API, it also offers reverse geocoding features. OpenCage Geocoder distinguishes itself through its open-source nature, which promotes customization, transparency, and broad community support. Like its Google counterpart, it, too, can be integrated with various open-source geospatial technologies, including PostGIS, GeoServer, Leaflet, and QGIS. This integration allows geospatial applications to perform complex geocoding tasks, delivering an enriched experience to the end user.
As soon as the problem of property valuation and tax collection problem is defined, the data needs are looked at; often—through steps 2 and 5 in the workflow, data gaps become apparent, particularly field data. This need has brought to the fore mobile-based tools like ODK Collect and KoBo Toolbox, software platforms designed for digital field data collection. Designed to capture a wide range of data, these tools are versatile and adaptable to various situations, providing a means to gather quantitative and qualitative data directly from the field. They allow for creating customized surveys, ensuring the collected data aligns with the project's specific needs. Further, the data input and aggregation features streamline the entire data collection process, eliminating the traditional challenges of manual data entry and organization. Such tools are just as important as the others, and in many situations where data is scarce or sketchy, the project's success depends on them.
SOFTWARE#7: Mobile-Based GIS Survey and Data Collection Software: Regarding GIS usage, ODK Collect, and KoBo Toolbox have immense potential. They allow for the collection of spatial data from the field, providing a basis for comprehensive spatial analysis when integrated into a GIS. The surveys designed on these platforms can collect geographic coordinates manually or through GPS, which can then be tied to other collected data like environmental variables or demographic information. These data can then be imported into GIS software, facilitating spatial visualization and analysis. ODK Collect and KoBo Toolbox support efficient data collection and offer an effective interface with GIS in many field applications today, enabling the visualization and analysis of data in relation to its physical location. Integrating with open-source GIS software ensures that is integrated into the same loop along with QGIS, PostGIS, and other tools.
ODK Collect: An open-source tool designed for Android smartphones that facilitates straightforward data collection. With its form builder, users can create customized survey forms accommodating various question types. The app can share these forms with field data collectors, allowing real-time data entry. Collected data can then be uploaded to a central server for further access and analysis. For GIS integration, ODK Collect enables geographic data collection through the smartphone's GPS capabilities or by manually inputting coordinates. The data can be exported into various GIS-compatible formats such as CSV or KML, making it conducive for use in GIS software platforms like QGIS.
KoBo Toolbox: It is another potent open-source tool for digital data collection. It allows for creating surveys and field data collection through its mobile app and supports data aggregation and analysis. One key feature of KoBo Toolbox is its robust support for complex survey structures, such as skip patterns and validation conditions, making it a versatile tool for various projects. Like ODK Collect, KoBo Toolbox enables geographic data collection, further solidifying its value for GIS purposes. This data can be exported into GIS-compatible formats, facilitating seamless integration with GIS platforms. Moreover, KoBo Toolbox provides built-in support for GIS integration, fostering visual mapping and spatial analysis of the collected data.
The efficacy of ODK Collect and KoBo Toolbox is amplified when used alongside other open-source software like QGIS, PostGIS, and MapServer. QGIS, for instance, can be used for advanced spatial analysis of the data collected through these platforms. At the same time, PostGIS allows for querying and managing the data in a PostgreSQL database environment. MapServer can be employed to publish the collected spatial data on web applications for broader access and use. To c conclude, ODK Collect and KoBo Toolbox provide an effective solution for field data collection not just in a municipal finance problem, as the tone outlined in this case study but in any context, enhancing the accuracy and efficiency of the process.
Jump to Part 2 here.
This article offers a detailed examination, from the lens of software engineering and coding, of a case study on the use of Geographic Information Systems (GIS), Workflows, Open-Source Software, Application Areas, and Spatial Data Infrastructure (SDI) within the scope of municipal finance. We crafted this to help our client's engineering teams grasp the wide array of possibilities and the subtleties of integration. We aim to provide a succinct yet exhaustive overview that avoids excessive complexity while shedding light on the infrastructures, applications, and use cases we frequently champion in our solution delivery. OHK often uses GIS and SDI in its planning and analytics work; contact us if you want to learn more about this work.

