
NEOM’s Line – Can It Line Up with Reality? Examining the Practical Constraints in Delivering a 170-Kilometer Linear City Vision
Urbanism, complexity, and Saudi ambition — following the line from bold vision to practical challenge, and where it bends under the weight of reality
The Line in NEOM has captured the world’s imagination, redefining what a 21st-century city could look like. Its ambitious vision—stretching 170 kilometers, powered by renewable energy, and designed for car-free living—positions Saudi Arabia at the forefront of global urban innovation. Yet, even the boldest ideas must be grounded in practical realities. Throughout history, great projects have thrived when visionary ambition is matched with functional design, cultural integration, and long-term resilience. This article examines The Line from a planning and operational perspective, identifying key challenges that must be addressed for the project to succeed. These are not criticisms, but technical and urbanist considerations intended to support constructive dialogue. Drawing from global experience, historical precedents, and our own early planning work in NEOM—which originally envisioned a central sea canal as the organizing spine—we aim to provide insights that can help translate aspirations into a functioning, flourishing city.
The intent is clear: to offer perspectives that can transform The Line from an extraordinary concept into a livable, resilient, and economically sustainable reality. This is Part 1 of a two-part series; Part 2 will focus entirely on solutions and design adaptations that preserve NEOM’s ambition while addressing its risks. These proposals will strengthen livability, resilience, and viability, ensuring The Line inspires the world and endures as a functional urban landmark.
Disclaimer / Note: Given the scale and visibility of this project, it is important to clarify our position. This perspective is offered with deep respect for Saudi Arabia’s leadership, the NEOM development vision, and the talented design and engineering teams working on The Line. The observations and analyses presented here are grounded in technical expertise, with the goal of contributing to the project’s long-term success. They reflect a recognition of the extraordinary ambition behind The Line, and an understanding that transformative projects benefit from diverse viewpoints, rigorous assessment, and open dialogue. The purpose is not to diminish the vision, but to explore practical considerations that can strengthen it.
Note on Reading Time and Purpose: This article is intentionally detailed, with a reading time exceeding one hour for most audiences. That is by design. Every point is grounded in quantifiable data, historical precedent, and technical calculations, ensuring the analysis stands up to scrutiny. We examine not only urban morphology, but also engineering, environmental impact, socioeconomics, safety, maintenance, and technological vulnerability. Comparisons to global precedents—from Paris and Manhattan to the U.S. Interstate Highway System and the Burj Khalifa—are included to make the scale and risks tangible. The precision is deliberate. This study took OHK six months to complete, and we welcome informed debate. We invite other consultants and technical experts to challenge our assumptions and contribute to the dialogue, in the shared interest of The Line’s long-term success.
Reading Time: 60 min.
All illustrations are copyrighted and may not be used, reproduced, or distributed without prior written permission.
Drawing the Line: An Insider’s Perspective on Vision, Reality, and 170 Kilometers of Challenges
Over fifteen years ago, a team from OHK worked to develop the first comprehensive master plan for NEOM, working at the project’s earliest conception stage. That initial work provided us with a deep understanding of the region’s constraints, opportunities, and ambitions—an understanding that continues to shape why we care so deeply about The Line’s trajectory today. In contrast to the current proposal for a rigid, uninterrupted linear city, our concept envisioned a more dynamic and diversified urban region anchored by a manmade sea canal threading through the desert. Far from being only an infrastructure element, the canal served as a structuring framework—cooling the microclimate, enabling maritime movement, fostering interconnected economic clusters, and attracting sustained investment.
Our continuing engagement with the region has allowed us to follow The Line’s evolution with both respect for its ambition and a pragmatic eye toward its feasibility. Through detailed analysis, we have identified around 50 distinct areas of concern—ranging from engineering and environmental considerations to social, economic, and resilience factors. In this article, we focus on 13 of these priority challenges: points where the technical and conceptual underpinnings may be most exposed, and where lessons from our original canal-based vision offer meaningful, alternative perspectives. The intention is not to diminish the ambition, but to place it within a practical framework, explore comparative planning logics, and highlight potential adjustments that could help The Line mature into a more resilient, functional, and enduring urban system.
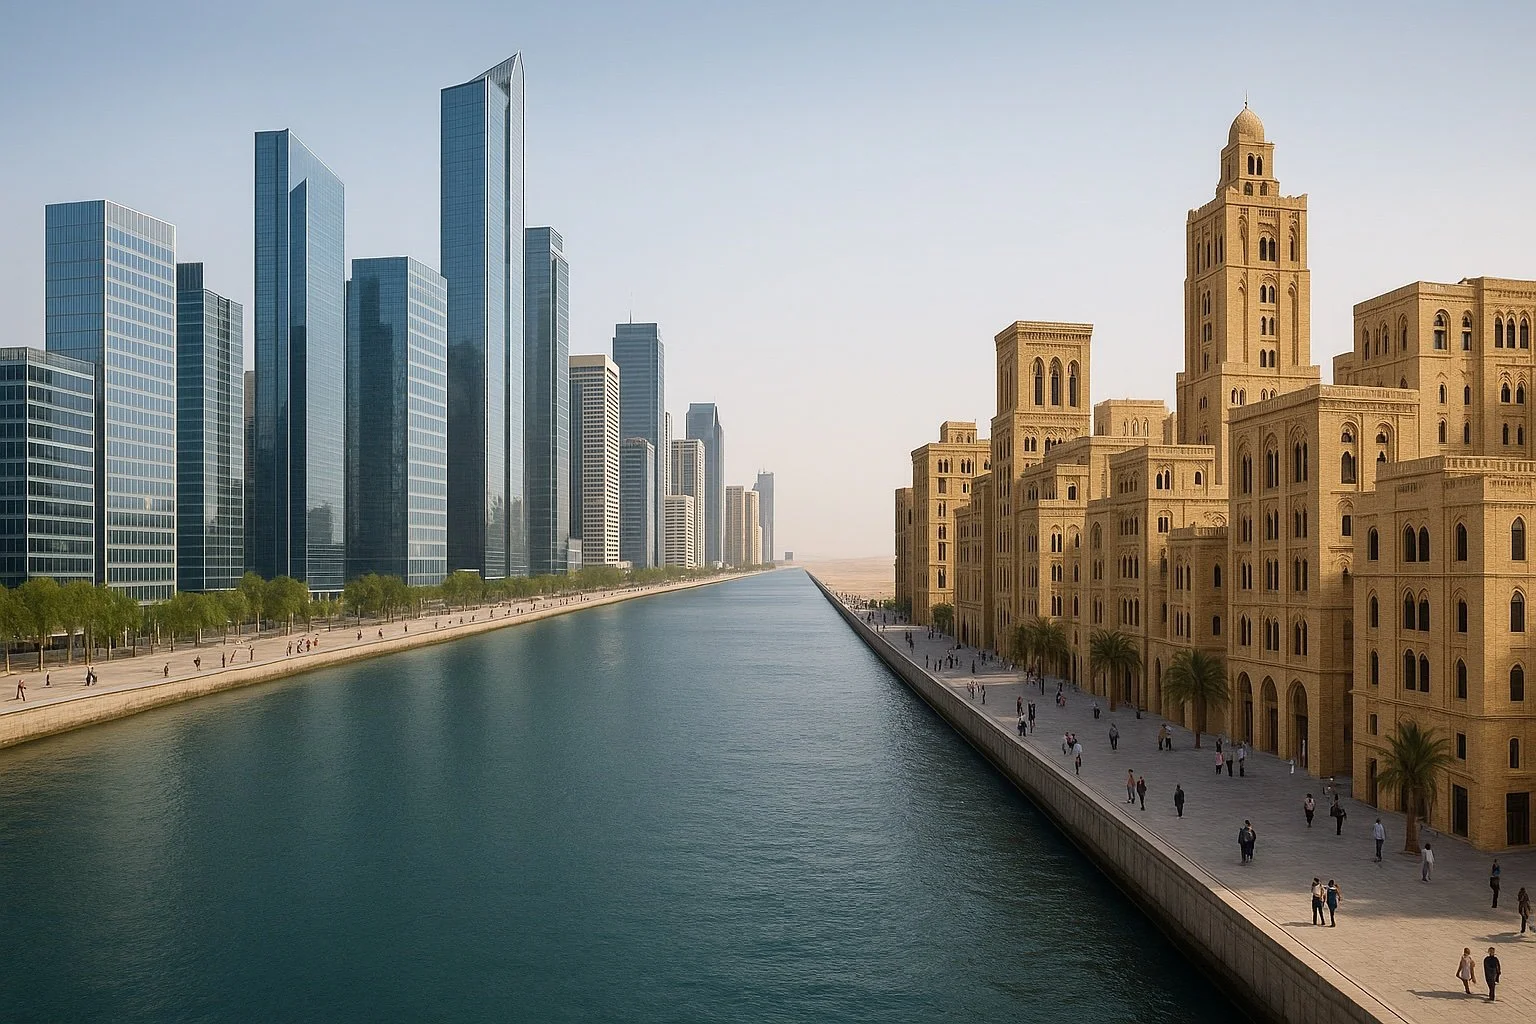
Chicago on the Red Sea – OHK’s Original Vision for a Wide, Sea-Fed Canal System Bringing Urban Energy to the Desert

OHK’s canal design captures the essence of a great urban waterway — a wide, open channel framed by vibrant civic life on both banks. Much like Chicago’s celebrated Riverwalk, the canal is not merely an infrastructure element, but a central stage for urban activity. The waterway’s generous width creates a sense of openness and grandeur, allowing uninterrupted views along its length and across to the opposite bank. On either side, the design layers modern urban functions: pedestrian promenades, landscaped seating areas, cultural venues, dining terraces, and spaces for public gatherings. The intention is to create a sequence of active zones, where residents and visitors alike can engage with the water in multiple ways — walking, sitting, watching, boating, or simply enjoying the changing play of light on the surface. By one measure — combined waterfront public-realm width per kilometre of canal — Chicago’s Riverwalk in its core section offers roughly 0.016–0.024 km of accessible public space per kilometre of waterway. This is calculated by adding the average public-realm width on both banks: for example, a left bank width of 0.01 km plus a right bank width of 0.012 km equals 0.022 km combined per kilometre of canal. In OHK’s concept, the figure rises to approximately 0.08–0.12 km per kilometre of canal, owing to its wider channel and generous landscaped banks and development on both sides. This represents roughly five times the accessible waterfront edge for civic life compared with Chicago’s Riverwalk. The result is not only greater capacity for activity but also a stronger visual and social impact, making the waterway a true urban centerpiece.
Where it diverges from Chicago’s model is in context. Chicago’s river is flanked by a dense, historic skyline that grew organically over a century, integrating layers of architectural heritage. OHK’s canal envisions a more intentional urban fabric — modern, carefully planned, and possibly situated in a desert or coastal environment where water is a rare and celebrated element. The contrast between lush, shaded public life along the banks and the surrounding natural landscape makes the waterway itself a striking visual and cultural centerpiece. In both cases, the canal serves as more than a piece of infrastructure — it is an identity-defining urban spine, a place where commerce, leisure, and community converge along the rhythm of the water. In terms of urban performance, The Line’s form is ultra-dense and brittle: a single disruption along the spine can sever tens of kilometers of access. Chicago’s polycentric grid distributes load, re-routes around incidents, and creates texture through blocks, corners, bridges, alleys, and multiple river crossings, encouraging spontaneity and resilience. OHK’s canal concept borrows this resilience by incorporating perpendicular boulevards every 300–500 meters, secondary streets spaced at 120–180 meters, and an intersection density of 70–90 per square kilometer — numbers aligned with highly walkable, mixed-use districts. Activity hubs are planned every 400–600 meters, combining bridges, transit stops, and civic spaces into recurring “urban nodes.” Two surface transit lines run parallel to the canal, supplemented by ring or feeder systems every 1–2 kilometers for cross-canal trips, ensuring each pair of adjacent hubs has at least three distinct access routes. While The Line pushes human occupation into extreme compression, OHK’s plan aims for humane high density — 15,000 to 25,000 people per square kilometer in core mixed-use areas, tapering outward — paired with active edges, schools and clinics every 800–1,000 meters, and a generous public waterfront unmatched by Chicago’s core. In effect, OHK’s canal creates the atmosphere of “Chicago in the desert” without inheriting The Line’s fragility, offering more waterfront per kilometer, more choices per trip, and fewer single points of failure.
In OHK’s original design, as the rendering shows above, there was indeed a linear building form that may have inspired The Line — yet the intent and execution were fundamentally different. The concept, which predates the current Line, stretched for about 3 km — almost like running the edge of New York’s Central Park which is about 4 km along the North–South sides (the long edges). This was not an ultra-dense vertical wall, but a low-rise research and development cluster, deliberately sited between two contrasting realities: the shimmering water on one side and the vast desert on the other. From the desert side, the building massing was more protected, while the sea side was not a single continuous block but rather a composition of several distinct buildings connected by public spaces and walkways. Across the entrance channel from the Red Sea stood a high-rise cluster serving as a visual counterpoint. The composition created a powerful sequence — from the water’s edge, past the low-rise structures, toward the vertical punctuation of the towers beyond. In keeping with the local context, the design incorporated elements of traditional Tabuk architecture, a vernacular rooted in the city of Tabuk in northwest Saudi Arabia, known for its shaded arcades, wind-catching openings, and earth-toned masonry that tempers the desert climate. Not all high-rises were envisioned as reflective glass monoliths; several adopted matte façades, textured surfaces, and deep recesses to mitigate glare and heat gain, ensuring the skyline felt appropriate to a desert environment rather than imported wholesale from temperate-climate cities. This blending of modern program with climatic and cultural intelligence anchored the canal not only as an infrastructural and urban statement, but as a place that could belong authentically to its setting.
Within the high-rise cluster, there was another canal running through (not shown in the rendering) — comparable in scale to Dubai Marina’s main waterfront promenade, the curved man-made canal that stretches about 3 kilometers from end to end, following the inner water’s edge. Like Dubai Marina, it was framed by continuous waterfront activity, tightly choreographed. If anything, the high-rise cluster resembled a hyper-polished, master-planned “slice” of a Chicago-style skyline transplanted into a new context. If Chicago is a full orchestra — with brass (historic buildings), strings (modern glass), percussion (cultural landmarks) — here it was more like a string quartet: sleek, tightly arranged, high-polish, but with less historical layering. It’s fair to call that part of our NEOM design “an echo” of Chicago’s waterfront skyline — not a full version of it. Our OHK-design high-rise cluster would have had about 250 high-rises, surpassing Dubai Marina—especially within Phase II of Dubai Marina, which forms what’s called the "world’s tallest residential block." The development area of the cluster was intended to be 5 M m² with a FAR ≈ 0.95 and a typical floor-to-floor of 3.5 m. The enclosed building volume was ≈ 16 M m³, which spread over the whole site gives an “equivalent solid height” of only ~3.3 m (i.e., highly porous massing). By contrast, THE LINE is a 170 km × 200 m × 500 m envelope: footprint 34 km², enclosed envelope volume 17 km³; using a notional 4 m floor-to-floor yields a theoretical max GFA ≈ 4.25 B m² (for scale only). Our NEOM high-rise massing/enclosure is an order-of-magnitude lighter, and THE LINE’s full envelope is ~1,000× our design’s enclosed volume. As evident in the OHK high-rise cluster rendering, the two sides of the canal present distinct architectural identities: on the Crystal Quarter, sleek and polished glass towers—making up approximately 70% of the skyline—dominate with their shimmering façades, reflecting modern design trends and contemporary materials. Across the water in the Heritage Heights, the remaining 30% rises with textured façades, traditional motifs, and warmer materials, drawing inspiration from local Tabuk architecture and forgoing the heavy use of glass in favor of a more grounded, historically resonant aesthetic.
1. The Spatial Paradox: Cities Are Not Lines—Why Packing 264,000 People/km² into a Corridor with a 1.0 Connectivity Index is Urban Fragility by Design
Urban civilization has never evolved as a straight line—for good reason. Cities are complex, adaptive systems that form through accretion, intersection, and polycentricity. The Line violates this logic by prescribing a singular spatial axis over 170 kilometers long and just 200 meters wide. In essence, it forces urban life into a corridor—narrow, inflexible, and linear. This rigidity creates planning oddities. Consider how people move, interact, and access services in a real city. In most metropolises, distances from homes to schools, clinics, groceries, or friends span short, interwoven paths. By contrast, The Line imposes a single-axis dependency, with vertical zoning stacked in layers and transport relegated to underground high-speed systems. The claim that one can travel end-to-end in 20 minutes masks the spatial and experiential dislocation this imposes. A community at kilometer 15 may have no meaningful relationship to another at kilometer 155.
Moreover, the linearity eliminates the possibility of dynamic urban centers—places where density meets diversity and chance encounters generate innovation. These nodes, which form organically in all great cities—from Paris to Tokyo—are spatially incoherent in The Line. It forecloses diagonals, perimeters, bypasses, and tangents: the spatial tools cities use to breathe. This isn’t just a design flaw. It’s a denial of what cities are. By abstracting the city into a rendered line, the designers of The Line ignored the fundamental truth of urban morphology: cities succeed not because they are streamlined but because they are irregular, complex, and alive.
Getting technical, urban morphology studies show that average travel radii in walkable, high-density cities rarely exceed 1–1.5 km for daily needs. In Paris, for example, 80% of errands and social visits occur within a 15-minute walk radius—a compact, multidirectional area. By contrast, The Line stretches 170 km, meaning that two neighborhoods at opposite ends would be over 100 times farther apart than the functional radius of most urban districts. In a typical polycentric city, multiple hubs reduce dependency on any single transit corridor. London has at least five major urban centers and dozens of secondary nodes, each with its own economic gravity. This polycentricity shortens trips and allows for route flexibility when one area is congested or under maintenance. The Line’s single-axis dependency means that a service disruption in one part of the underground transit system could paralyze movement for tens of kilometers in either direction—there is no bypass, detour, or alternate path.
In urban planning and network theory, a connectivity index is a measure of how well the elements of a network (like streets, transit lines, or utility grids) are interconnected and how many alternative routes exist between any two points. A low connectivity index means the network (whether streets, transit, or pathways) has few connections between nodes, so there are limited route options and low redundancy. From a purely quantitative standpoint, The Line’s urban form has the connectivity of a pipeline rather than a city. Urban planners often use the connectivity index, calculated as the ratio of street segments (links) to intersections or access points (nodes). A healthy, resilient city typically scores between 1.6 and 1.8, meaning there are multiple alternative routes between any two points. Manhattan, for example, has roughly 2,000 intersections and 3,500 street segments, giving it an index of about 1.75. Central Paris scores similarly, at around 1.71. By contrast, The Line’s 170 kilometers of corridor, with a hub or station every kilometer, yields, for illustration purposes, only 170 nodes and 169 links—an index of 0.99. This is the mathematical signature of a single-axis system: any disruption between two nodes effectively severs the corridor, with no redundancy or alternative routing. Where Paris or Manhattan offers dozens of possible paths for the same trip, The Line offers exactly one. Urban planning research suggests that systems with fewer than three alternative paths between most points are highly vulnerable to localized failures. The Line offers essentially one path for high-speed movement and one vertical elevator path per cluster, with no horizontal redundancy beyond walking—an impractical option when distances between key facilities could be 5–10 km in a straight corridor.
Population distribution also becomes spatially brittle. With 9 million residents spread evenly across 170 km, each kilometer segment would house about 53,000 people—roughly the density of Manhattan. Manhattan is often held up as an extreme case of urban density, yet its form is radically different from what The Line proposes. Manhattan packs approximately 27,000 residents per square kilometer across an island roughly 21.6 km long and 3.7 km wide, producing a polycentric network of neighborhoods linked by a dense street grid. The street network’s connectivity index is around 1.75, meaning residents have multiple route options between any two points, reducing congestion and enhancing accessibility. By contrast, The Line’s proposed geometry is 170 km long but only 200 meters wide. Even if it housed its target of 9 million residents, the gross density would reach ~264,000 residents per square kilometer—nearly ten times Manhattan’s—but in a corridor with a connectivity index of a perfect line, the lowest possible for an inhabited urban form. This means there is only one path between most points: forward or backward along the corridor. Any breakdown in the underground high-speed system would instantly create mobility bottlenecks, as there are no alternative surface routes, diagonals, or tangential connectors. Manhattan’s density works because it’s coupled with redundancy and diversity of access—subway lines, buses, ferries, and a walkable grid that disperses trips in all directions. The Line’s density, by contrast, is singular and brittle: it achieves numerical compactness but at the expense of resilience, spontaneity, and the spatial richness that allows cities to adapt and thrive over centuries. Unlike Manhattan, the Line populations cannot spill over into adjacent neighborhoods along diagonal streets; they are locked in a fixed sequence. This creates urban isolation chambers where social, cultural, and economic interactions are confined to the vertical stack and the immediate kilometer segment, unless one boards a train to reach elsewhere.
Just to link this back to OHK’s original “Chicago in the Desert” concept, The Line’s projected density is 58 times higher than Chicago’s citywide figure of 4,531 people per square kilometer, spread across 606 square kilometers. In The Line, planners many argue that a cross-grid is unnecessary because there are no cars—movement relies instead on a central high-speed spine, local walking corridors, and possibly automated shuttles within the 200 m width. While this arrangement eliminates vehicle congestion, it still creates a single-axis dependency, meaning a disruption in the main spine can still sever access for tens of kilometers. Chicago’s multidirectional grid, by contrast, achieves almost double that og the Line, offering numerous alternate routes between any two points and supporting an intersection density of 70–100 per square kilometer. The Line’s lack of lateral redundancy means that, while pedestrians can move east–west within a single 200 m band, they cannot bypass a blocked segment without re-entering the main spine. Chicago’s polycentric structure, with blocks typically 120–180 m wide, repeats dozens of times per kilometer, ensuring daily needs and services fall within a 1–1.5 kilometer radius in multiple directions.
It is worth mentioning that the two density figures of the Line calculated above refer to different ways of measuring population concentration and should not be confused. The 53,000 people per kilometer figure represents linear density—the number of residents in each one-kilometer stretch of The Line’s length. This metric is useful for visualizing how many people would live in a given “slice” of the corridor, but it does not account for the actual land area. The 264,000 people per square kilometer figure, by contrast, is the gross areal density—calculated by dividing the total population (9 million) by the total footprint area of The Line (170 km × 0.2 km = 34 km²). This is the standard density measure used for cities. In other words, while the linear density helps explain crowding along the length of the structure, the gross areal density shows just how compressed that population would be within the extremely narrow footprint.
2. The Logistics of Impracticality: Infrastructure Without Logic—The Line Consuming Up to 8× the UK’s Electricity
The engineering claims surrounding The Line are as ambitious as they are implausible. An enclosed city 170 kilometers long but only 200 meters wide introduces enormous logistical inefficiencies in transport, utilities, and maintenance. To support nine million residents, The Line would require continuous high-speed rail tunneling, countless vertical lift systems, and climate control in a desert environment—all within a narrow strip. This is not simply a matter of cost; it’s a matter of compounded fragility. As mentioned, a single system failure—whether transport, waste, or energy—can disrupt the entire city. There are no redundancies. Unlike traditional cities, where disruptions can be absorbed across a distributed grid, The Line is a single point of failure stretched across desert. Construction logistics are equally daunting. Building a 500-meter tall mirrored wall over a distance longer than the drive from New York to Philadelphia requires an uninterrupted supply chain in one of the harshest geographies on Earth. Every ton of concrete, every pane of mirrored glass, every data cable must be sourced, transported, assembled, and maintained in sequence—at a scale with no precedent in human history. By contrast, OHK’s canals-based master plan was conceived around phased construction, distributed development zones, and climate-sensitive orientation. Instead of one massive megaproject, our model allowed for incremental growth—urbanism as a living process, not a rendered object. It made infrastructure work with geography, not against it.
The Line’s logistics are not just costly; they are incompatible with sustainable, adaptive development.
From an infrastructure engineering standpoint, The Line’s geometry drives up per capita service requirements to unprecedented levels. A continuous high-speed rail spine running the full 170 kilometers would require at least 4 to 6 parallel track systems (local, express, freight, maintenance) to maintain headways sufficient for nine million daily users. Even our optimistic capacity models suggest that moving just 10% of residents simultaneously during peak hours would require the equivalent of moving the entire population of Chicago every morning—through a single linear tunnel system with no alternative routes. Let’s run some numbers. High-speed rail construction in challenging geographies averages $60–120 million per kilometer, meaning the 170-kilometer underground transit spine could cost $10–20 billion just for tunneling and rail infrastructure—before accounting for stations, power systems, and rolling stock. These figures also exclude the enormous premium for building in extreme heat, where material fatigue, workforce conditions, and specialized equipment can inflate costs by 15–30%. Operating expenses are equally astronomical—the upkeep of high-speed rail systems (typically 4–5% of capital costs annually in normal conditions), vertical transport systems, centralized waste management, and AI-controlled monitoring, and, very conservatively, right-off-the-bat, The Line could be facing recurring O&M expenditures of $10–15 billion annually, The Line’s ongoing operations would rival the entire yearly budgets of cities like Los Angeles or San Francisco—just to keep systems running
We’ll get a bit more technical here, because The Line’s energy demand hinges on two key factors: how much of its volume is actually enclosed and cooled, and how efficient that cooling is. The project’s footprint is 34 million m² per “level” (170 km × 0.2 km), but the raw number of vertical “levels” (floors) in a 500 m tower isn’t the same as the equivalent conditioned floors (ECF) — the total full-footprint floors’ worth of space that is enclosed and climate-controlled after subtracting internal voids and sky gardens. This is where the conditioned floor area ratio (CFAR) comes in — the share of each level that is actually cooled, which can range from 0.15 for a very open design to 0.35 or more for dense mixed-use. Using conservative annual cooling intensities of 150–300 kWh per square meter per year (kWh/m²·yr), the numbers scale quickly: a low-intensity case with 60 levels, CFAR 0.15, and high-efficiency cooling still consumes 46–67 TWh per year — about 2–3.5 times Jordan’s 2023 electricity use of ~19 TWh. A more plausible mixed-use case with 80 levels, CFAR 0.25, and ~250 kWh/m²·yr jumps to ~170 TWh/yr (~9× Jordan), while a high-enclosure case with 100 levels, CFAR 0.35, and ~300 kWh/m²·yr reaches ~357 TWh/yr (~19× Jordan). Even with large internal voids and aggressive efficiency measures, the scale of the footprint means The Line’s climate-control demand alone would almost certainly a threshold never seen before. the energy demand for climate control alone is staggering.
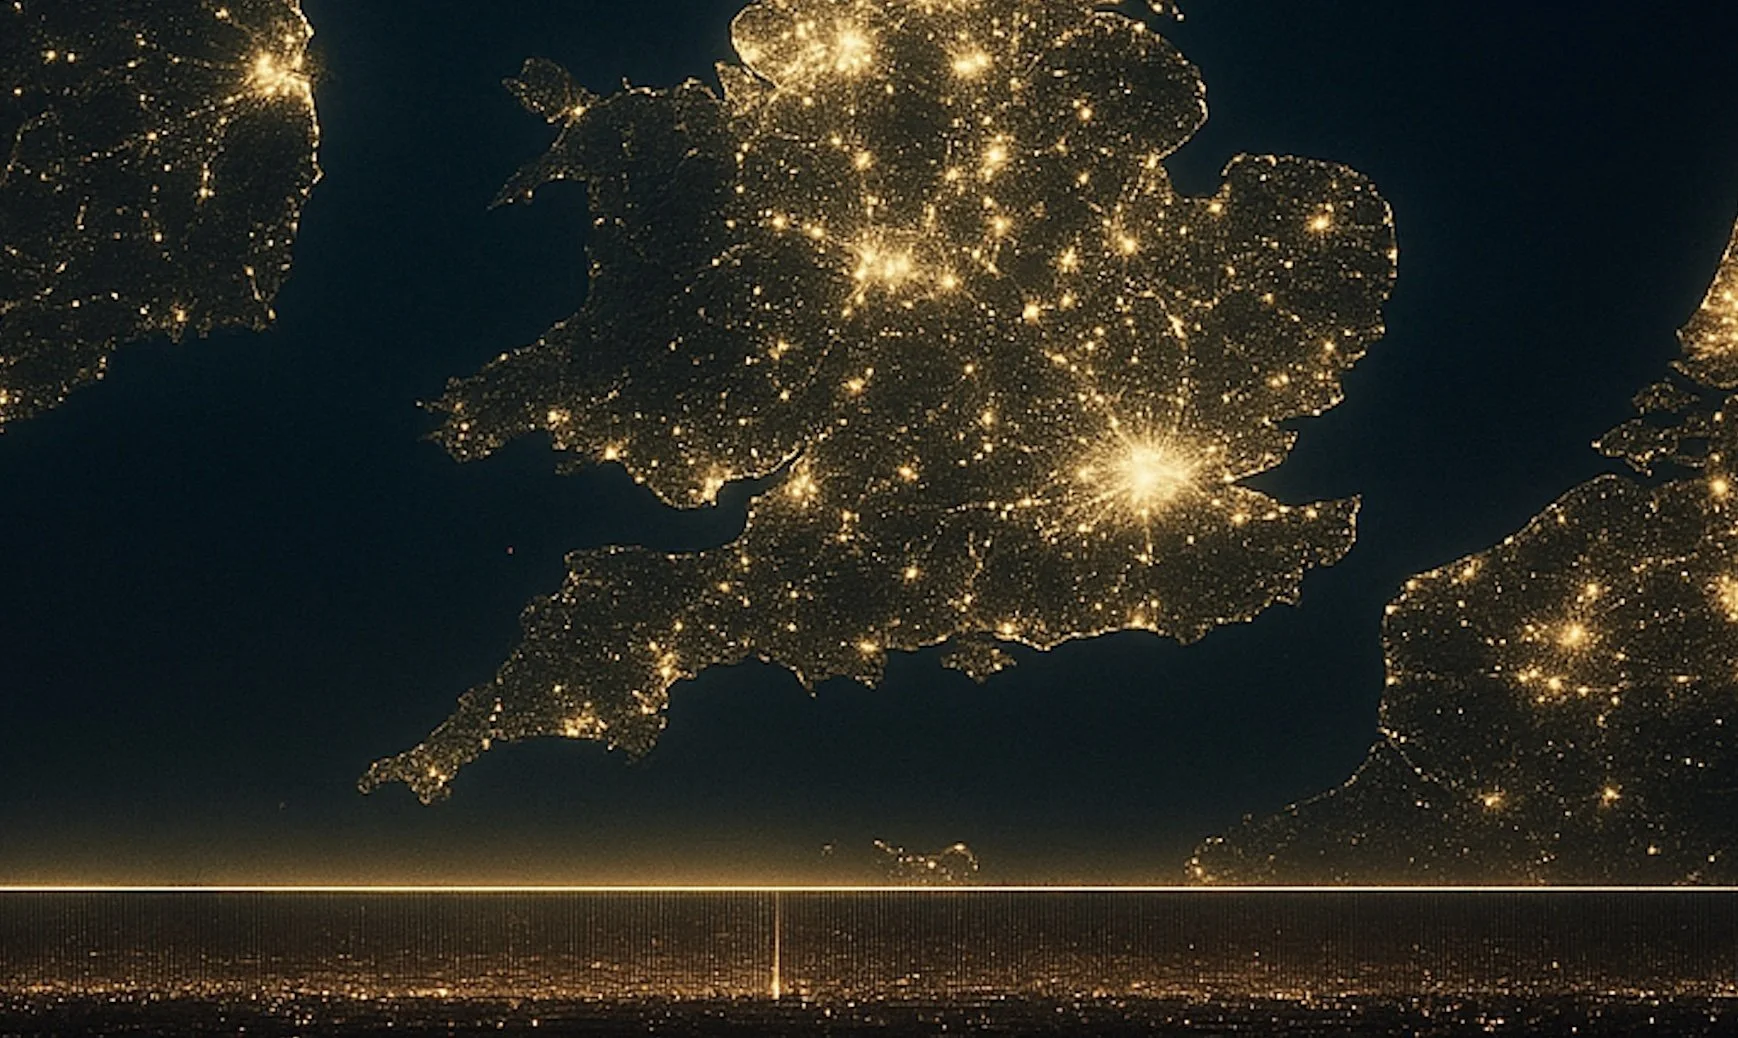
Even our modest assumptions put The Line’s annual electricity demand in the same order of magnitude as that of an entire national grid, and more realistic assumptions push it far beyond. At the lower threshold, it could require 46–67 terawatt-hours per year, roughly matching the total electricity consumption of countries like Switzerland or Portugal. At the higher threshold, demand could reach around 157 terawatt-hours annually, on par with nations such as Spain or South Africa. When you add the city’s needs — lighting, elevators, high-speed rail, vertical transport systems, desalination and water pumping, data centers, waste treatment, and the massive embedded automation — the total operational demand could more realistically be 50–80% higher. This would push The Line’s total electricity consumption into the range of 250–640 TWh per year, depending on enclosure and efficiency assumptions. That’s 3–8 times the total electricity use of the entire United Kingdom in 2023 — an unprecedented scale for a single urban development.
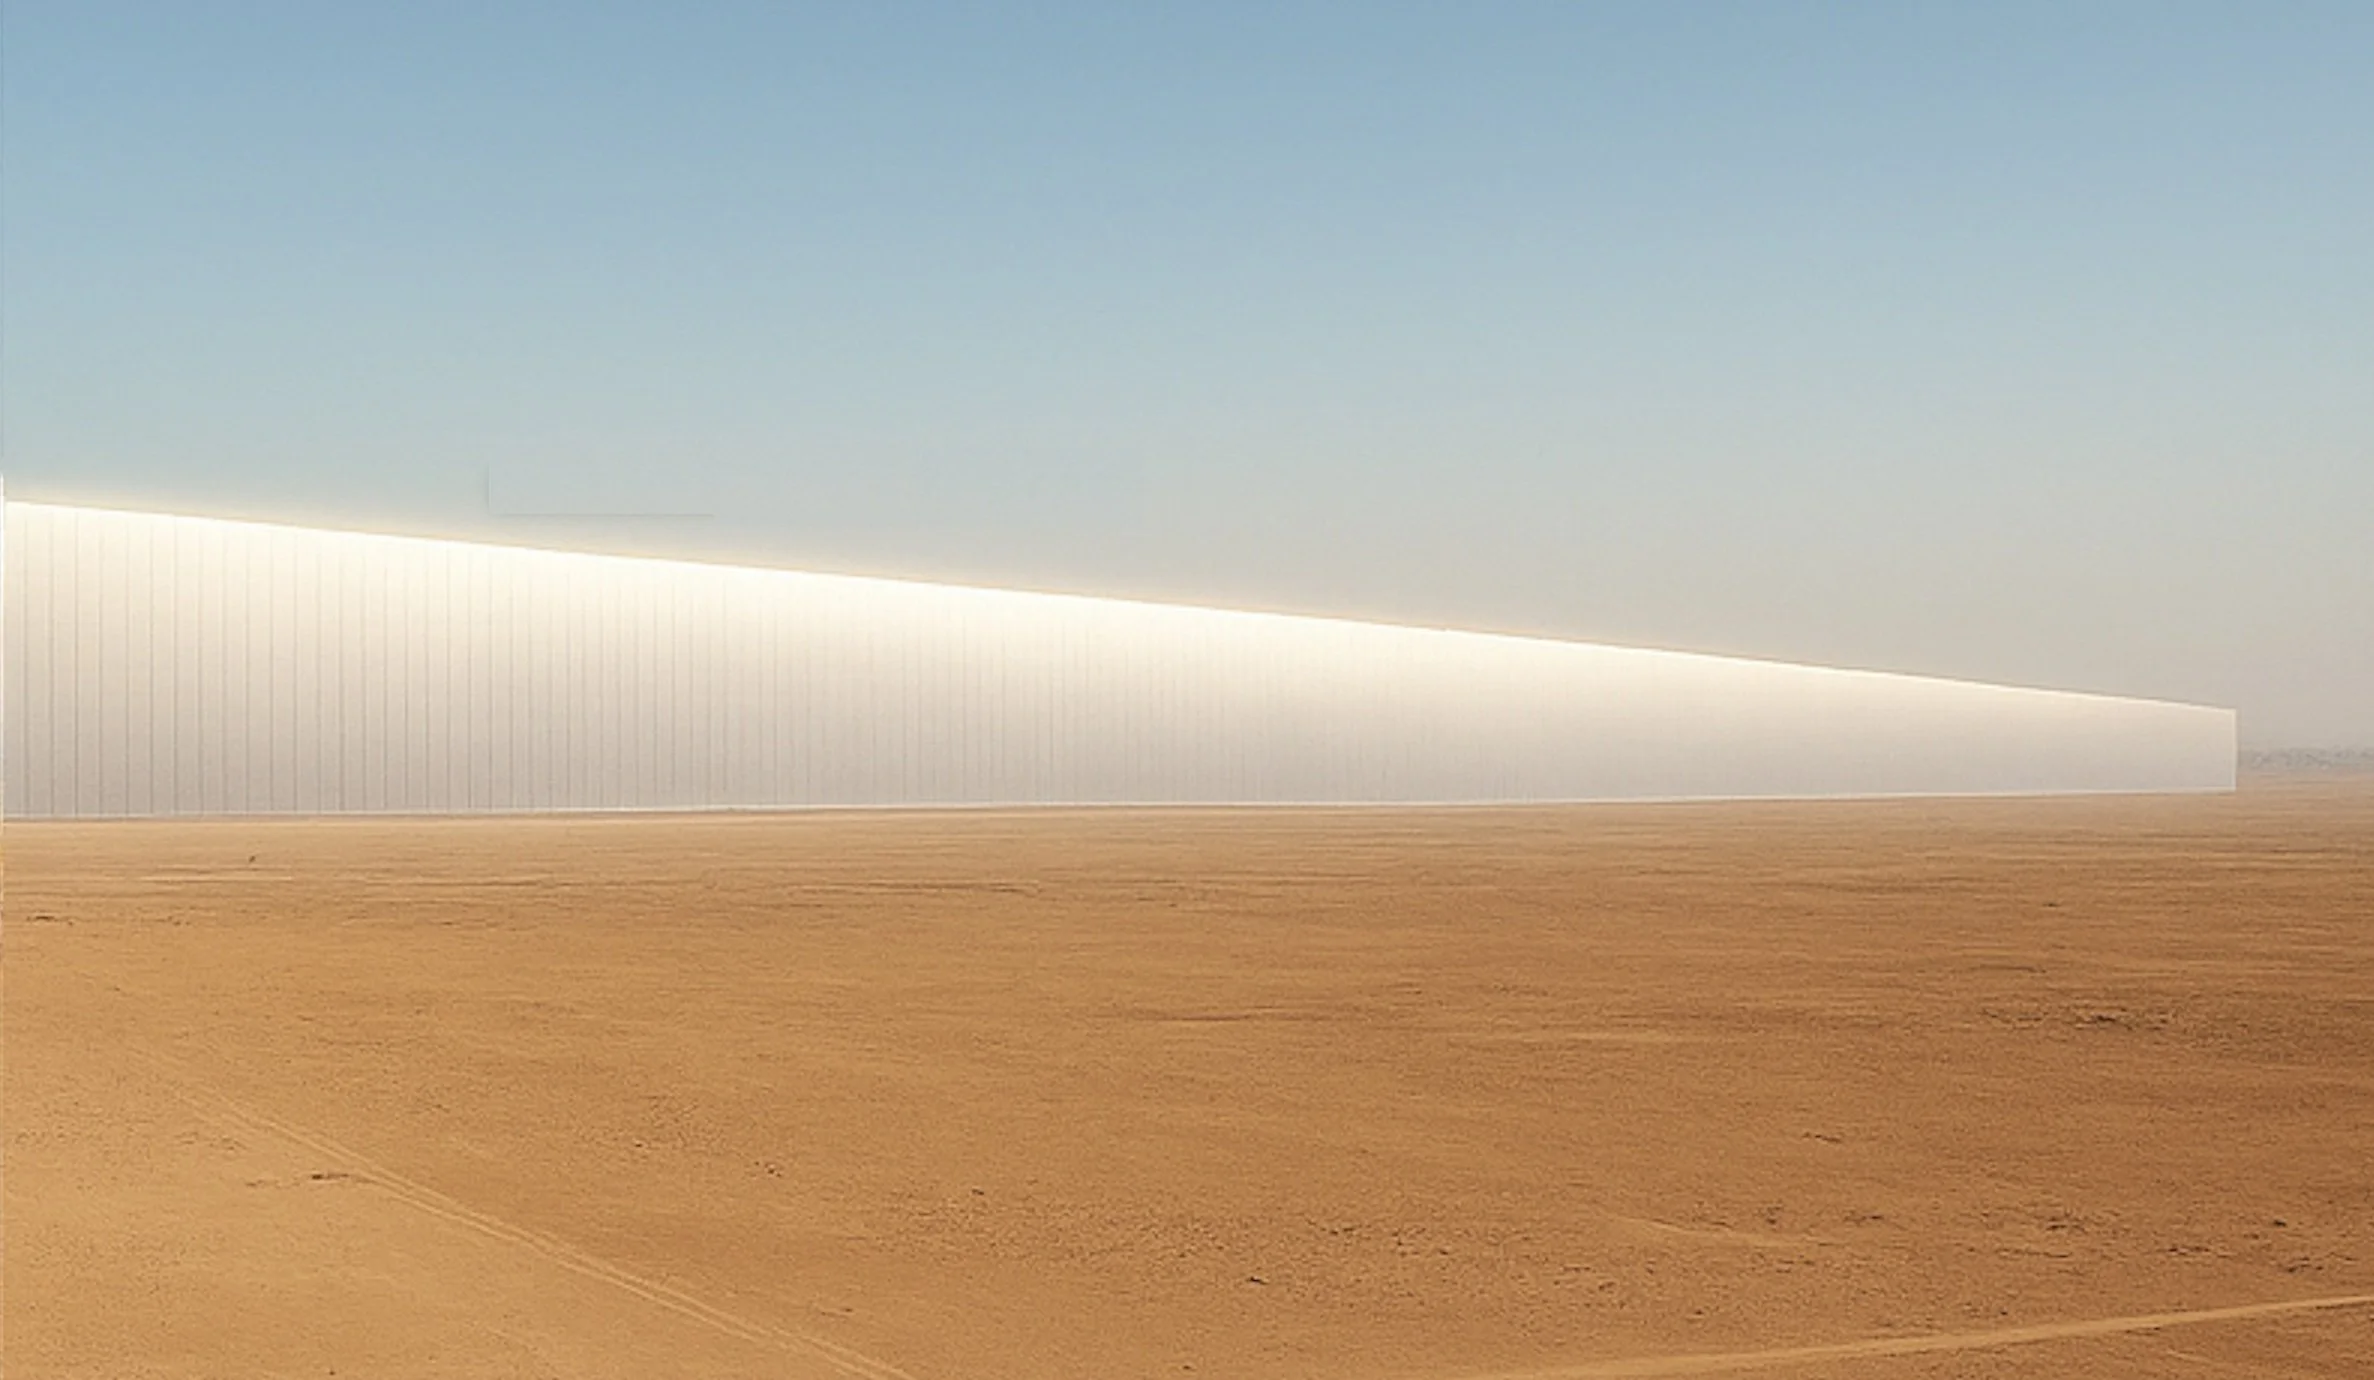
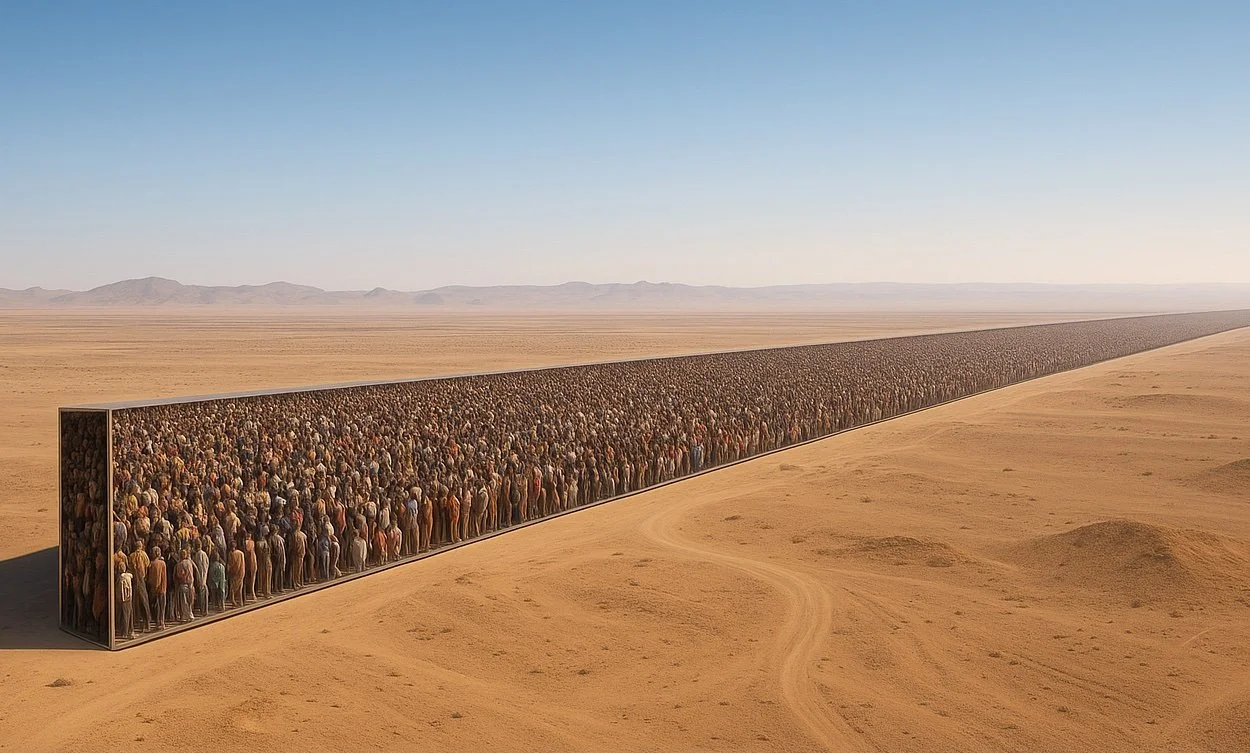
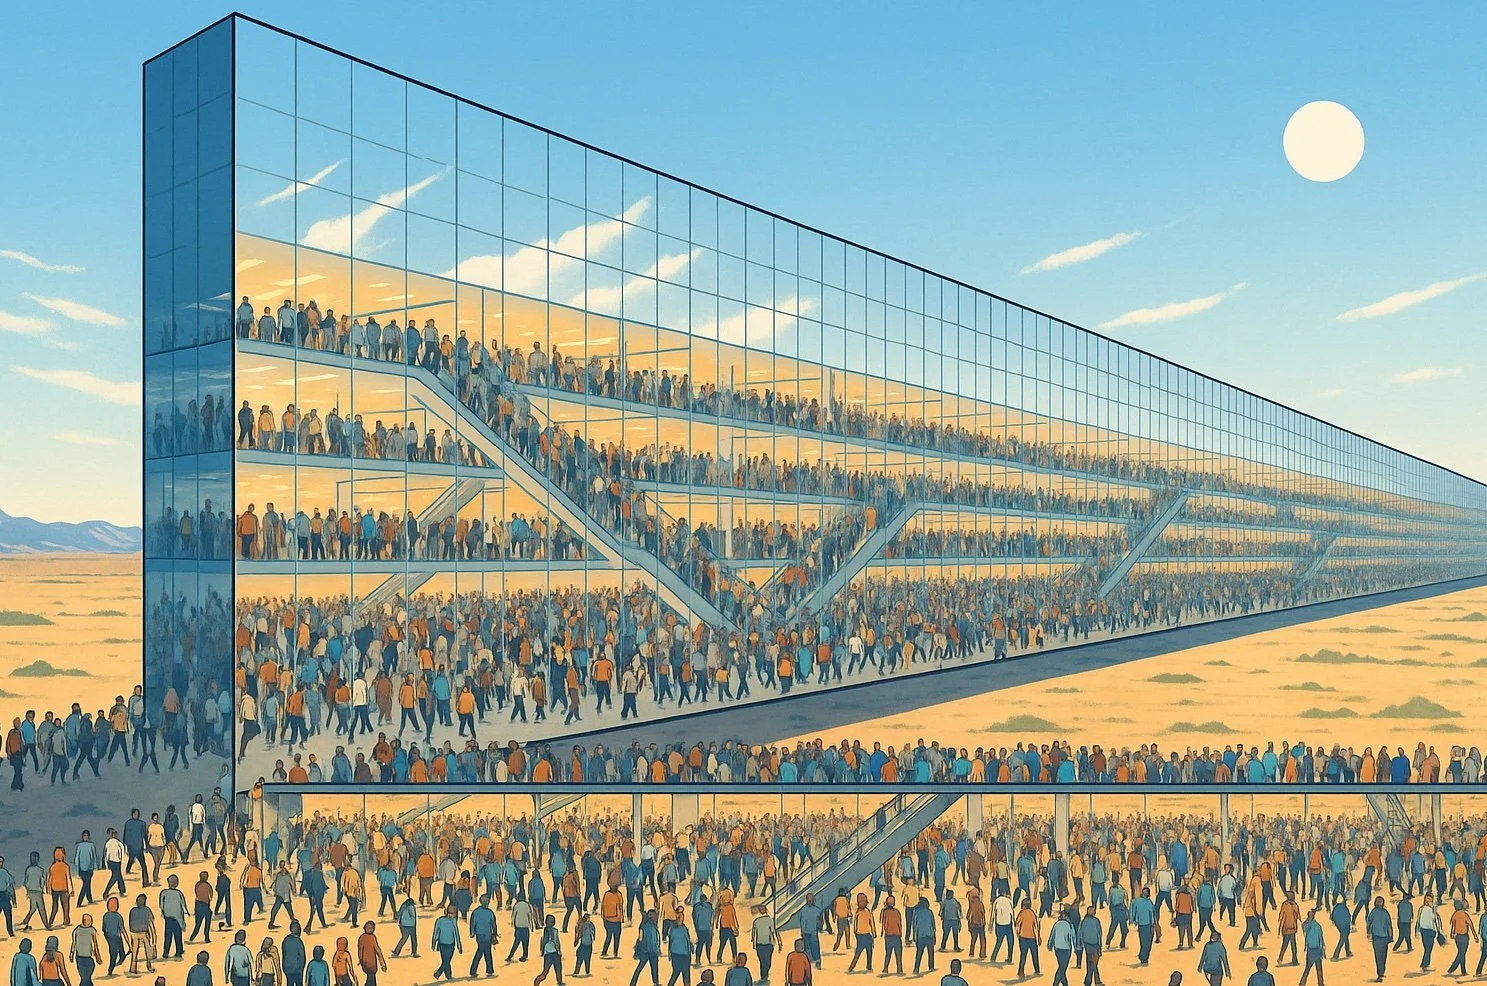
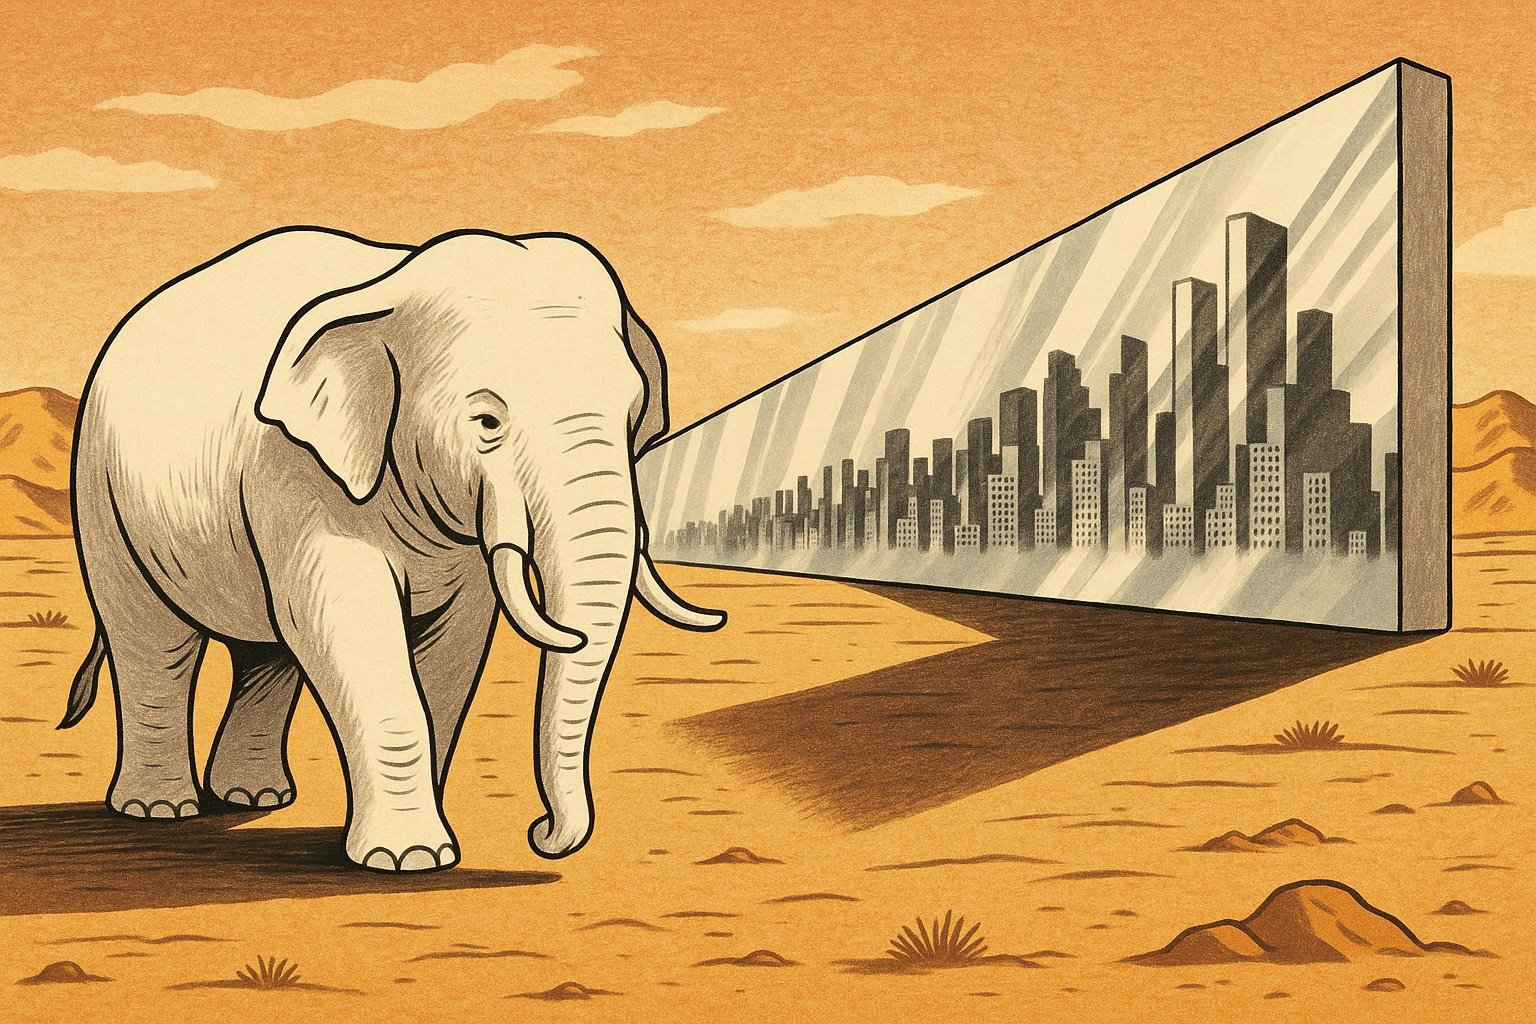
3. Human Experience in a Mirror Box: Life Inside an Enclosure Up to 30 Times the Size of All New York Skyscrapers
Living in The Line means living in a continuous mirrored corridor. While visually striking in renderings, the mirrored façade raises profound questions about psychological well-being, cultural disconnection, and architectural alienation. Humans orient themselves through diversity of space, not symmetry. The uninterrupted linearity and vertical stacking of functions—residences above offices above public transport—create a spatial uniformity that disorients rather than grounds. Without courtyards, public squares, or varied street corners, urban life risks becoming sterile and robotic. Mirrors themselves are problematic. Beyond the ecological impact, they offer no thermal value and only intensify the sensation of enclosure. The absence of visual horizons, sky views, or meaningful variation leads to sensory deprivation. Light pollution, temperature reflection, and constant artificial regulation replace natural rhythms. Furthermore, life in The Line is expected to rely heavily on automation, AI, and centralized systems. From climate control to surveillance, every detail is controlled. This contradicts the essence of urbanism and adaptation. In OHK’s original plan, the sea-connected canals was meant to introduce water-based promenades, shaded pedestrian zones, and organic clusters of housing and business—spaces for identity, chance, and delight. The Line, by contrast, risks creating a sanitized environments, optimized for efficiency but hollowed of humanity. In the name of utopia, The Line threatens to become a laboratory of automation, not a city for people.
In all great cities, public spaces—plazas, parks, sidewalks—act as stages for civic life. These are the places where cultural exchange thrives. The Line’s ultra-vertical, programmed environment—controlled by AI and digitalization—leaves no room for spontaneous civic action. Imagine a child growing up in The Line: no openness, no alleyways, no visual diversity, no informal gathering points—just endless mirrored walls and managed experiences. Such an environment risks increasing social anxiety, alienation, and mental health issues. Humans are not designed to live in hyper-controlled, homogeneous spatial systems. Cities need texture, unpredictability, and even imperfection to feel alive. OHK’s original plan emphasized biophilic design, porous edges between built and natural environments, and opportunities for unstructured play—essentials for psychological well-being.
Research into urban living consistently shows that contact with nature—whether through parks, street trees, or even small pockets of greenery—has measurable benefits for mental health. Large-scale population studies in Europe found that individuals living within 300 meters of open green space reported significantly better overall well-being, with measurable reductions in anxiety and depression rates. Another multi-city survey showed that just two hours per week in natural settings was associated with a marked improvement in mood and cognitive function. Living near accessible green areas has also been linked to reduced loneliness, lower stress hormone levels, and up to a 20% drop in antidepressant prescriptions in urban districts. Equally important is the role of visual diversity and access to horizons. Humans orient themselves through variation, depth, and changing perspectives, and this is reflected in decades of environmental psychology research. Studies in work environments have found that employees with views of nature or varied street scenes report up to 15% higher job satisfaction and lower fatigue levels. Experiments in controlled architectural spaces show that uniform corridors and mirrored walls—when experienced over extended periods—can impair spatial memory, slow orientation times, and increase reported feelings of confinement. The absence of windows, sky views, or natural textures disrupts the brain’s sensory processing, while excessive visual repetition erodes a person’s sense of place and connection.
In this context, The Line’s mirrored corridor, with its extreme uniformity and lack of natural relief, risks creating a psychologically challenging environment. Without informal gathering points, varied streetscapes, and unpredictable encounters—the same elements that define the vibrancy of cities like Barcelona or Kyoto—residents may face a controlled but emotionally flat form of urban life. Over time, such conditions have been associated with higher social withdrawal, reduced civic participation, and slower recovery from stress. In contrast, OHK’s canal-based plan envisioned water-adjacent promenades, shaded pedestrian routes, and clusters of mixed-use districts that would naturally introduce variety, openness, and the sensory richness needed for long-term human well-being.
When you translate the earlier conditioned floor calculations into actual enclosure volume, the scale becomes even clearer. In our most conservative low-intensity case — 60 levels, CFAR 0.15 — The Line would have about 306 million m² of enclosed, climate-controlled floor area. For reference, the total combined enclosed floor area of every skyscraper in New York City (using the Council on Tall Buildings and Urban Habitat’s definition of buildings 150 m and taller) is on the order of 25–35 million m². This means that even in its most open and efficient configuration, The Line’s enclosed space would be roughly 9–12 times greater than the entirety of New York’s skyscraper interiors. In the more plausible mixed-use scenario — 80 levels, CFAR 0.25 — The Line’s enclosed floor area rises to about 680 million m². That is equivalent to building an entirely new “New York skyscraper city” not once, but roughly 20 times over, then lining it all up in a single 170-kilometer strip through the desert. In the high-enclosure case — 100 levels, CFAR 0.35 — The Line would contain about 1.19 billion m² of enclosed space. That’s more than 30 times all of New York’s skyscraper interiors combined, but here concentrated into a single continuous megastructure.
When a single building contains 9 to 30 times the enclosed space of all New York City skyscrapers combined, it ceases to be a building in the human sense and becomes an environmental system in which residents are more akin to managed components than citizens. Cities thrive on diversity of form, scale, and experience; The Line’s enclosure would replace that with an engineered sameness on a scale no human population has ever inhabited. While the numbers help us grasp its physical enormity, they also point to something deeper: the loss of urban texture that gives life meaning. In compressing the equivalent of multiple global skylines into a sealed corridor, The Line risks not only overwhelming its environment but also erasing the serendipity, variety, and spatial freedom that make cities worth living in.
4. Environmental Contradictions: Sustainability in Name, Not Practice—A Carbon Footprint Rivalling the Entire EU

The Line markets itself as a net-zero, eco-conscious city of the future. Yet its environmental narrative is undermined by both its design and its construction. Start with the mirrors. A 170-kilometer wall of reflective glass in the desert is an ecological hazard. It disrupts local wildlife, causes bird fatalities—a problem already documented in glass-heavy high-rise developments in cities like Chicago and Toronto, intensifies heat island effects, and consumes extraordinary energy for cooling. The idea of enclosing nature in a narrow strip denies the ecological integrity of the broader landscape. Moreover, building in a pristine desert ecosystem requires vast carbon expenditures. The cement and steel needed for 500-meter towers, excavated tunnels, and AI-managed systems would produce emissions at massive scales—well before a single inhabitant moves in. These embodied carbon costs are rarely mentioned in promotional materials.
Then comes the water problem. Desalination in NEOM relies on high-energy systems. The Line’s enclosed form eliminates any natural water flows or aquifer recharge zones. In contrast, OHK’s canals concept served multiple environmental functions: it allowed for passive cooling, evaporative systems, and ecological corridors for desert biodiversity. Finally, by compressing everything into a narrow strip, The Line concentrates energy demands—cooling, lighting, transit—in an intense band rather than dispersing them across zones with microclimate opportunities. It’s not energy-saving; it’s energy-intensifying. Sustainability is more than claiming carbon neutrality. It’s about how a city relates to its land, resources, and natural systems. In that regard, The Line is a contradiction wrapped in glass.
Let’s build on the earlier comparison to New York that we attempted. What makes the comparison even more stark is the climate context. New York’s towers operate in a temperate climate with seasonal variation, allowing for periods of low cooling load. The Line would be attempting to maintain year-round climate control across an enclosure footprint many times larger than New York’s skyscraper stock — but in one of the hottest desert regions on Earth. In enclosure scale alone, it is not just the world’s biggest skyscraper; it is effectively an entire planet’s worth of high-rise city space compressed into a mirrored wall.
From an environmental standpoint, the implications are unprecedented. A terawatt-hour (TWh) is one billion kilowatt-hours, and generating 1 kWh from a conventional fossil fuel source typically produces 0.4–0.9 kilograms of CO₂ emissions, depending on the fuel mix. If The Line’s operational energy demand for climate control and all other systems — lighting, elevators, high-speed rail, vertical transport, desalination, water pumping, data centers, waste treatment, and embedded automation — reaches the projected 250–640 TWh per year, the resulting annual CO₂ emissions could range from about 100 million to over 575 million tonnes of CO₂ per year if powered primarily by fossil fuels. For context, the entire United Kingdom’s annual emissions in 2023 were about 330 million tonnes, meaning The Line could emit between 30% and 175% of the UK’s total output, depending on its energy mix. Even with 100% renewable (RE) generation, the scale of material and land use for solar farms, wind installations, or other clean sources to meet such demand would itself be vast, potentially requiring tens of thousands of square kilometers of dedicated RE infrastructure.
The embodied carbon — the greenhouse gas emissions from producing the building materials — would also be staggering. Producing one tonne of Portland cement generates roughly 0.9 tonnes of CO₂, while structural steel averages around 1.85 tonnes of CO₂ per tonne produced. Given that The Line’s structure could require hundreds of millions of tonnes of concrete and steel for foundations, superstructure, and façade, the embodied carbon footprint could easily surpass 1–2 gigatonnes of CO₂ before the first resident moves in. For comparison, that is more than the total annual emissions of the entire European Union. The mirrored façade adds another layer of impact: aluminum cladding production emits around 11–17 tonnes of CO₂ per tonne, and given the 170 km × 500 m façade surface, the total aluminum requirement could be in the tens of millions of tonnes. The desert location also implies massive water use for construction dust suppression, concrete curing, and mirror cleaning, with operational water demand compounded by desalination energy costs — desalination typically consumes 3–4 kWh per cubic meter of water produced. Assuming each resident uses only 150 liters (L) per day (GCC averages are often quoted as ~500–550 L/d, so 150 L/d would be a sharp reduction), nine million residents would require nearly 500 million cubic meters annually, adding 1.5–2 TWh to the energy bill and introducing brine disposal challenges that can harm marine ecosystems.
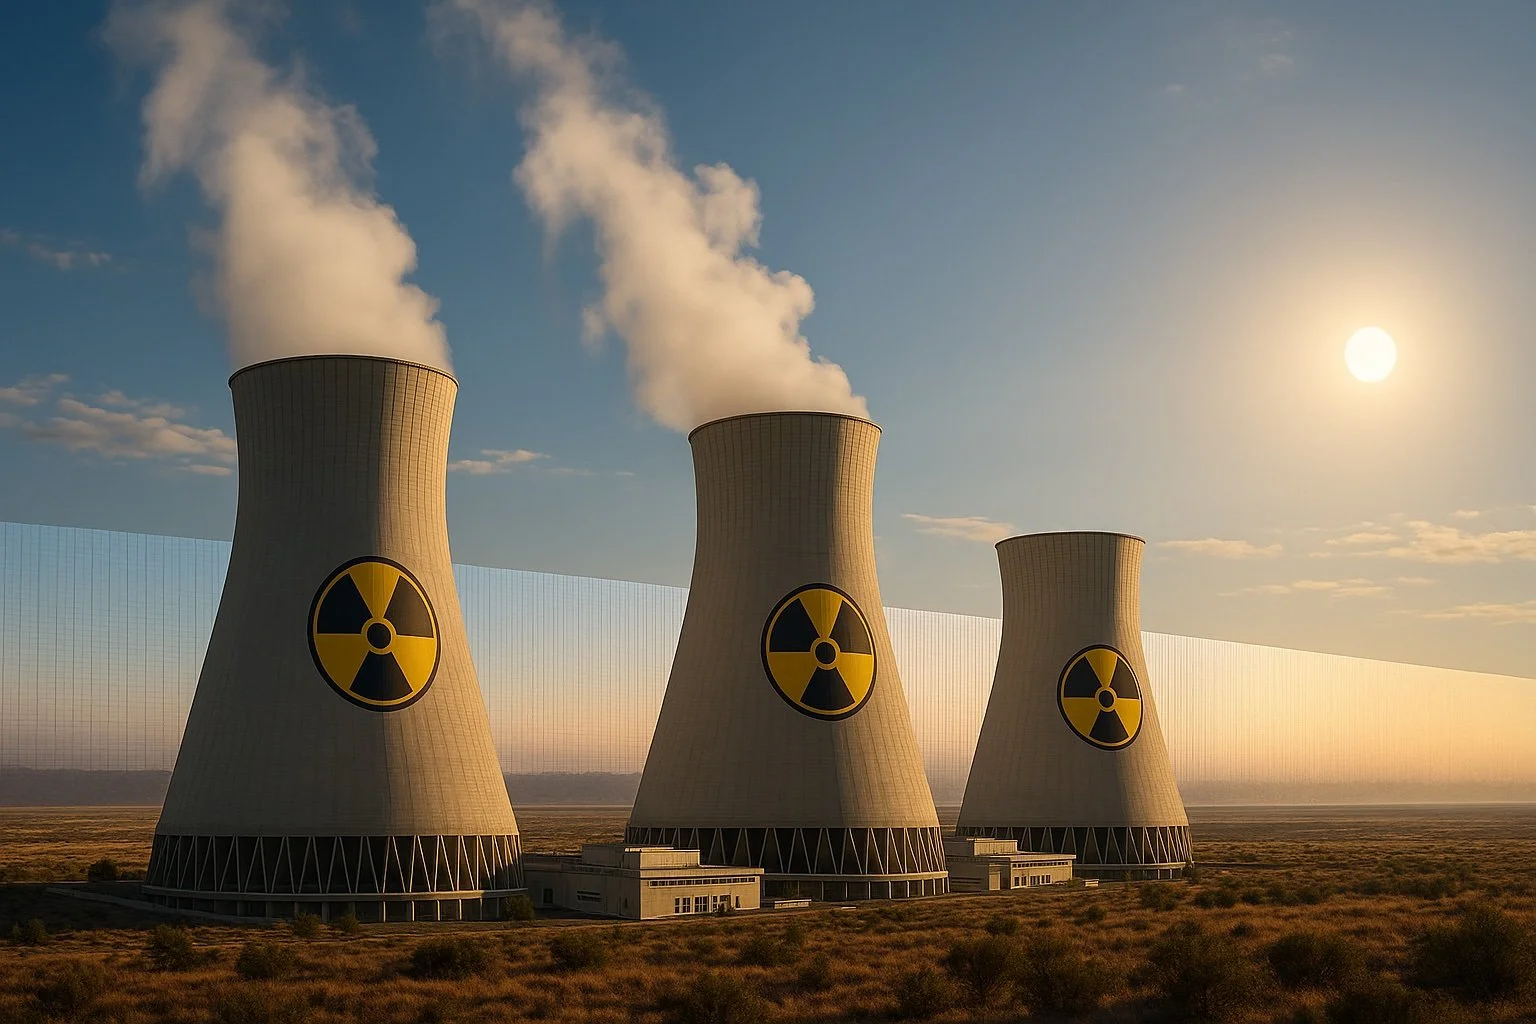
5. Thermal Mirror Effect: How The Line’s Façade Could Add Heat Equal to 2–3 Nuclear Power Plants
Heat reflection from the façade could also create localized thermal effects, increasing air temperatures around the structure and affecting regional wind patterns. Below, we quantify the “heat reflection” issue with clear assumptions, defined terms, and step-by-step estimates. This section is highly technical—feel free to skip the next paragraph and go straight to the last one in this section. We’re talking about a roofed, climate-controlled hall where incoming solar energy, internal reflections, and human activity all contribute to thermal loads that have to be actively removed by the HVAC system. By solar irradiance, we mean incoming short-wave sunlight in watts per square meter (W/m²). By transmittance (τ), we mean the fraction of sunlight that passes through glazing. By reflectance (ρ), we mean the fraction reflected by a surface—mirrored wall panels could have ρ≈0.85. By mean radiant temperature (MRT), we mean the single “felt temperature” that represents the combined effect of all radiant heat sources; MRT rises when sunlight or reflections strike the body. By ACH, we mean air changes per hour, a ventilation rate indicating how many times the air volume is replaced each hour. We are considering both the roof and the two long side façades of The Line as potential sources of solar heat gain into its interior. For the purposes of this analysis, the “roof” refers to any horizontal or near-horizontal surfaces that form the upper boundary of the enclosed space and are either transparent or translucent to sunlight. The “sides” refer to the 500-meter-tall, 170-kilometer-long vertical façades. These façades are assumed to consist of a mix of mirrored high-reflectance opaque surfaces and glazing, with the mirrored areas reflecting sunlight internally and the glazed areas transmitting it directly into the enclosure. All calculations are based on defined geometric and physical parameters, using conservative but representative values for a desert climate under clear-sky conditions.
The total roof area per linear meter of building length is 200 square meters (200 meters width × 1 meter length). Under peak desert conditions, the global horizontal irradiance can reach 1000 watts per square meter. If a fraction of the roof, denoted as f_roof, is transparent or translucent glazing, the incident short-wave energy per meter is given by: incident_roof = area × irradiance × f_roof. For a glazing fraction between 0.10 and 0.25, the incident solar power is 20 to 50 kilowatts per meter. With a typical solar transmittance τ_roof of 0.6 for clear glass with a low-emissivity coating, the transmitted load is 12 to 30 kilowatts per meter. Accounting for internal absorption after reflections, using an absorption factor of 0.60 (typical for enclosed architectural spaces with mixed surfaces), the absorbed sensible and radiant load from the roof is approximately 7.2 to 18 kilowatts per meter. The side façades present a much larger surface area. Each façade has 500 square meters per meter of length (500 meters height × 1 meter length). Under peak sun, vertical façades receive lower direct irradiance than horizontal roofs; here we use a representative vertical irradiance of 600 watts per square meter for desert conditions, averaged for solar angle and orientation effects over the length. If a fraction of the façade, denoted as f_side, is glazing, the transmitted load per side is given by: incident_side = area × irradiance × f_side × τ_side. Assuming a glazing fraction of 0.20 and a transmittance τ_side of 0.4, this yields 24 kilowatts per meter per side. With two sides, the total is 48 kilowatts per meter incident solar load. Applying the same 0.60 absorption factor results in 28.8 kilowatts per meter of absorbed load from the façades.
When roof and side contributions are combined, the total absorbed short-wave load becomes 36 kilowatts per meter (7.2 kW/m from the roof plus 28.8 kW/m from the sides) for 10 percent roof glazing, and 46.8 kilowatts per meter (18 kW/m from the roof plus 28.8 kW/m from the sides) for 25 percent roof glazing. Over the building’s full length of 170 kilometers, this corresponds to an instantaneous absorbed load of approximately 6.1 to 8.0 gigawatts under peak sun conditions. This load represents only the direct solar contribution and does not include internal heat gains from occupants, equipment, or artificial lighting. The microclimatic implications inside such a vast enclosure are significant. In terms of MRT, short-wave fluxes of the magnitude calculated here can produce radiant temperature elevations of +10 to +25 degrees Celsius compared to shaded conditions, even if the air temperature is controlled. This means that occupants could experience thermal environments far hotter than the cooled air temperature due to radiant heating from sunlit interior surfaces. The persistence of these conditions over long distances inside the structure could result in sustained thermal stress for people and materials alike.
For air temperature rise, a simplified steady-state ventilation balance can be used: ΔT ≈ Q_sens / (33,333 × ACH), where Q_sens is the absorbed sensible load in watts per meter and ACH is the air changes per hour. So, with an absorbed load of 46.8 kW/m and an air exchange rate of 3 ACH, the localized temperature rise attributable to solar gain alone is around 0.47 degrees Celsius; at 1 ACH, the rise increases to about 1.4 degrees Celsius. These increments are additive to baseline internal loads and can compound in poorly ventilated zones, creating persistent “hot bands” along the structure’s length. From an urban-scale perspective, the mirrored high-albedo façade will also reflect a substantial portion of the incident solar radiation back into the surrounding desert atmosphere, potentially altering local wind and thermal patterns. Over a continuous 170-kilometer stretch, this combination of large reflective vertical planes and partial glazing could contribute to mesoscale heat redistribution, influencing convection currents and possibly affecting microclimates beyond the structure’s immediate footprint. In summary, when both the roof and vertical façades of The Line are considered together, even with modest glazing fractions, the resulting absorbed solar load is in the multi-gigawatt range. This creates an unprecedented thermal management challenge for any enclosed building, with implications not only for cooling energy demand but also for occupant comfort, material performance, and local climatic effects.
Enough technical detail and calculation has been presented above to make clear that this is not a speculative claim, but a quantified assessment. The aim is not to overwhelm the reader with engineering minutiae, but to show that the conclusions rest on explicit assumptions and real thermal calculations. Using conservative values for glazing fractions and solar transmittance across both the roof and vertical façades, the enclosure would admit enough short-wave energy to impose an additional peak cooling burden of approximately 6.1 to 8.0 gigawatts city-wide, and an additional annual chiller electricity use of roughly 1.0 to 2.0 terawatt-hours, with potentially significant fan-power increases if ventilation rates are raised to maintain comfort. All of this comes on top of the base HVAC demand needed for occupants, equipment, conductive gains, and latent loads even without direct solar transmission. To put this in perspective, 6–8 gigawatts of thermal energy is roughly equivalent to the continuous heat output of two to three large nuclear reactors, or about the same as running one to two large reactors full-time purely to offset the heat admitted by the building’s own surfaces. This comparison underscores the extraordinary scale of the thermal management challenge. The Line’s form and materials are not simply reflecting or transmitting a small fraction of sunlight—they are admitting and trapping heat at a scale normally associated with entire national power plants. Such a burden would translate directly into higher operational energy demand, greater cooling infrastructure requirements, and a carbon footprint that undermines any claim to environmental neutrality. In sum, even under the most optimistic renewable energy and efficiency assumptions, The Line represents an environmental intervention of continental scale — in energy demand, emissions, material use, and ecological disruption — concentrated into a single, continuous, and unprecedented megastructure.
6. Ten Billion Lumens into the Night Sky: Measuring the Continental-Scale Light Dome and Ecological Reach of The Line—3x the Entire Light Network of Los Angeles

Artificial lighting from the continuous façade and interior illumination could disrupt nocturnal wildlife behavior and contribute to light pollution visible from hundreds of kilometers away. Let’s first specify the lighting geometry. The Line is 85,000,000 square meters per side, or 170,000,000 square meters if both sides are illuminated. For order-of-magnitude estimates, we consider efficient LED façade lighting with a power density of 5 watts per square meter. “Power density” is electrical power per area; at 5 W/m² across 170,000,000 m² the façade lighting draw would be about 850 megawatts if fully on. With a luminous efficacy of 120 lumens per watt (typical for architectural LEDs), the emitted luminous flux would be roughly 1.02×10¹¹ lumens. The “upward light output ratio” (ULOR) is the fraction that escapes upward or is reflected skyward; even with careful optics, 10 percent is a conservative real-world value once reflections and bright vertical surfaces are included. That implies ~1.0×10¹⁰ lumens injected into the night sky whenever the system is at full output. If façade lighting operates on average 12 hours per night, the annual electricity use just for the façades would be about 3.7 terawatt-hours per year at 5 W/m²; even a very conservative 1 W/m² scheme would still consume roughly 0.74 terawatt-hours per year. These figures exclude any interior lighting that leaks outward through glazing.
Skip this technical calculation part to the last paragraph of this section, if you will. To connect lighting to what wildlife and people actually experience, we estimate illuminance and skyglow. “Luminance” (cd/m²) is how bright a surface appears; high-end media façades can exceed 100 cd/m², while a modest architectural wash might target 5–10 cd/m². “Luminous intensity” (candela) describes how much light is sent in a given direction. Approximating a façade segment as a Lambertian emitter, the luminous intensity I towards an observer is I ≈ L × A_vis × π, where L is luminance and A_vis is the visible illuminated area. Consider a one-kilometer stretch of façade (1,000 m long × 500 m tall = 500,000 m²). At L = 5 cd/m², I ≈ 5 × 500,000 × π ≈ 7.85×10⁶ candela; at L = 100 cd/m², I ≈ 1.57×10⁸ candela. “Illuminance” (lux) at a distance r is approximated by E ≈ I / r² (inverse-square falloff). For the 5 cd/m² case, at 5 km perpendicular to the façade the illuminance would be E ≈ 7.85×10⁶ / (5,000²) ≈ 0.314 lux, comparable to or greater than bright full-moon levels (≈0.1–0.3 lux). At 20 km it drops to ≈0.02 lux, which still exceeds the behavioral disruption threshold reported for many nocturnal species (often ≤0.01–0.1 lux). For the 100 cd/m² media-façade case, the same 1-km segment yields ≈6.28 lux at 5 km and ≈0.39 lux at 20 km, producing night-time brightness that can overwhelm natural cues (navigation, foraging, predator–prey dynamics) well beyond the site. Because The Line is 170 segments of 1 km each, multiple lit stretches will be visible simultaneously; while you can’t simply sum intensities in all directions, the practical effect is a continuous horizontal band of light whose glow remains detectable tens to hundreds of kilometers downrange under clear conditions due to atmospheric scattering.
We now translate that persistent glow into “light dome” visibility. The injected upward flux of ~1.0×10¹⁰ lumens (from the 10 percent ULOR assumption at full output) is continuously scattered by aerosols and molecules into the line-of-sight of distant observers. While full radiative transfer modeling is beyond scope, we can sanity-check scale. Many large metro areas with upward fluxes in the 10⁹–10¹⁰-lumen range produce skyglow visible to the naked eye at 100–200 km under clear, dry conditions, and easily farther under thin high clouds because clouds back-scatter city light downward. The Line’s geometry concentrates emission into a narrow, continuous 170-km ribbon, increasing horizontal extent and the probability that at any given vantage point a bright segment sits near the viewer’s minimum atmospheric path. In practical terms, that means a visible glow band on the horizon under clear skies and a dramatically brightened sky under thin cloud decks, with astronomical sky quality degraded far beyond the project boundary.
Interior illumination adds a second channel: light escaping through glazing into the enclosure and out through roof or façade openings. Assuming interior perimeter zones along both façades are lit to a modest 100 lux average at night (typical commercial interiors), with a perimeter depth of 10 meters and a visible transmittance of 0.5 through glazing, the outward luminous exitance can be approximated as 50 lumens per square meter of façade footprint for those zones. If 25 percent of the façade area functions as window wall for those perimeter bands, the additional outward flux can readily reach the order of 10⁹ lumens along long stretches even without dedicated exterior accent lighting, reinforcing the light dome and increasing the area over which nocturnal wildlife encounters ecologically meaningful illuminance.
Finally, we link these light levels to ecological effect thresholds. Many nocturnal insects, migratory birds, sea turtle hatchlings, and small mammals exhibit measurable behavioral disruption at ground-level illuminances of 0.01 to 0.1 lux. Our façade-segment calculation shows that even a “soft” 5 cd/m² architectural wash can produce ≈0.02 lux at 20 km, which overlaps this sensitivity band; for brighter media-type luminance (100 cd/m²), the ≈0.39 lux at 20 km exceeds it several times over. Within 5 km, the same 1-km segment yields 0.314 lux (soft wash) to 6.28 lux (media façade), levels known to suppress melatonin in vertebrates, alter pollinator behavior, and cause mis-orientation in migratory birds. Because The Line stretches 170 km, many observers and animal communities will not be “off-axis” from a single point source; instead they will encounter a persistent, wide angular source, reducing opportunities for refuge from artificial light within the regional landscape.
In sum, even with efficient LEDs and conservative assumptions about glazing and optics, continuous façade and interior illumination at The Line’s scale implies multi-gigawatt-hour to terawatt-hour annual electricity use just for night lighting, upward luminous flux on the order of ten billion lumens sustaining a light dome visible far beyond the site, and ground-level illuminance at ecologically meaningful thresholds tens of kilometers from the structure, with much higher levels within a few kilometers. To grasp the scale, the Line’s estimated ten billion lumens of upward luminous flux is roughly equivalent to operating more than 650,000 LED streetlights—about three times the entire network of Los Angeles—all in one place. It is the same order of magnitude as lighting over 1,000 football fields to professional game standards simultaneously, every night. This is a night-sky visibility across a region comparable in size to a country. This is not a localized glow; it is a continent-scale light dome anchored to a single linear structure. These are continental-scale externalities concentrated into a single linear megastructure: the environmental intervention is not only in materials and energy, but also in the night-time luminous environment that governs behavior, navigation, and ecosystem function across a wide region.
7. Socioeconomic Disconnect—From Agriculture to AI: The Challenge of Creating 380,000 Tech Jobs in a Region Where Technology Contributes Under 1% to the Economy
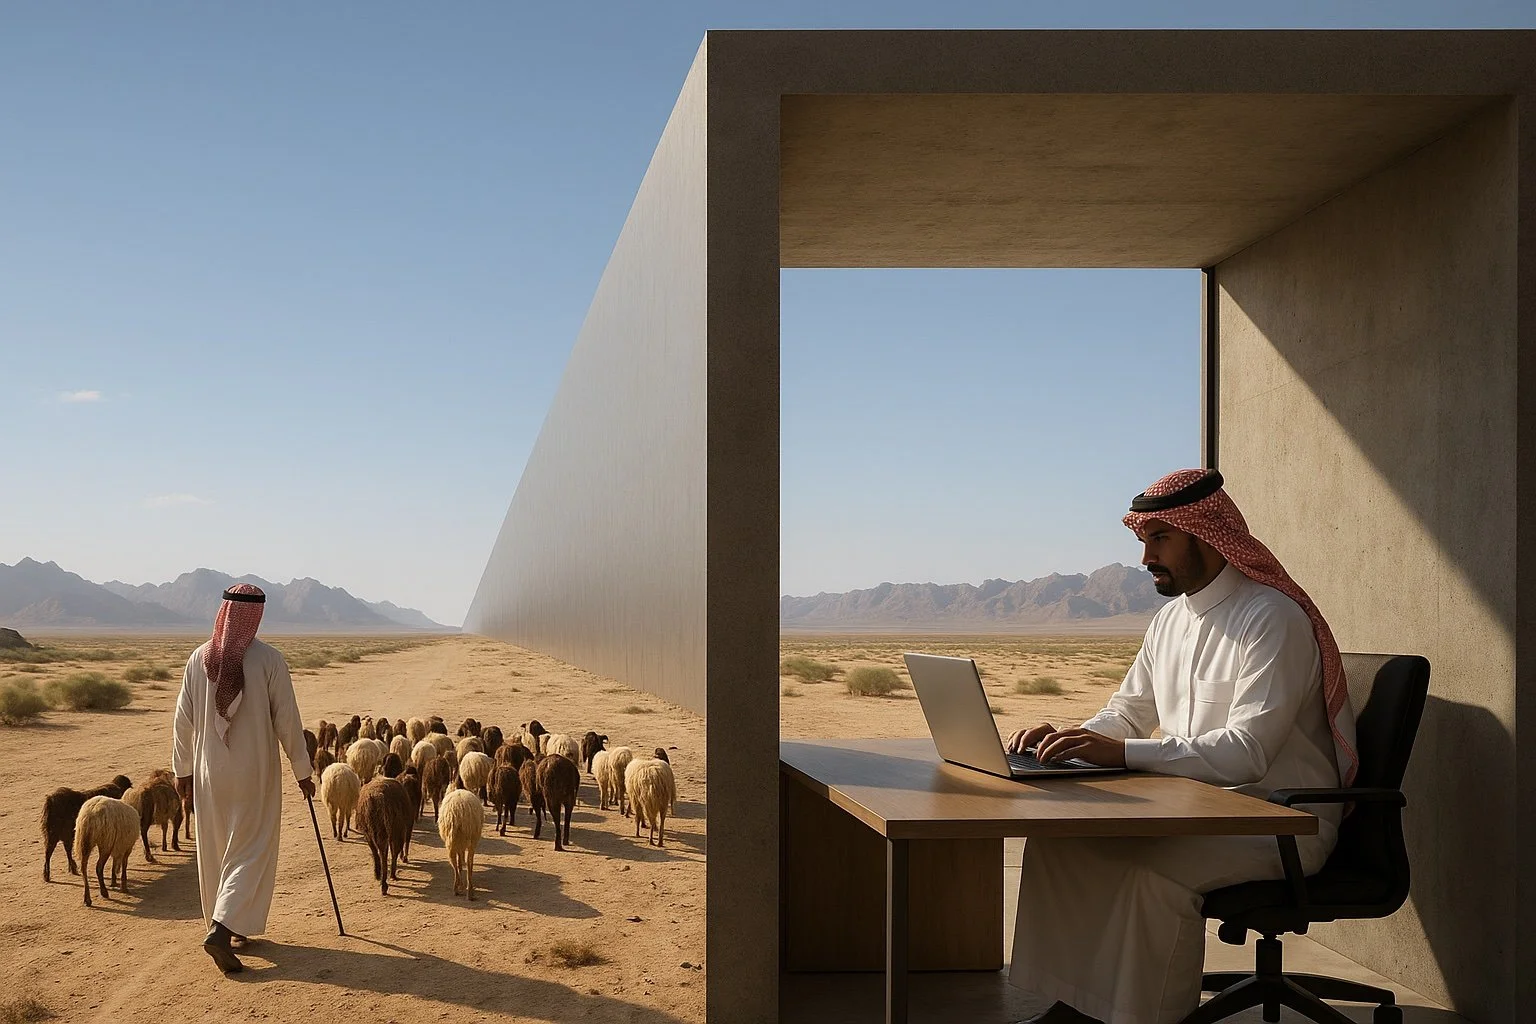
Cities thrive when they grow with their people—not despite them. The Line is being built from the top down, marketed to a global elite and AI economy that has yet to materialize, while local communities are displaced and regional economies ignored. Most striking is the absence of grounding. What industry anchors The Line? What culture defines it? What traditions are preserved? Unlike historic cities that evolved over centuries through trade, pilgrimage, agriculture, or ideology, The Line is a conceptual export—an imagined future with limited connection to social foundations. The people of Tabuk region, who have lived in the area for generations, have not been central to its design. Relocations have occurred, and traditional livelihoods—herding, farming, craft—have no place in the vertical smart city vision. This may be viewed by critics as modernization at the cost of continuity. Meanwhile, the job creation promised by The Line assumes a digital economy ecosystem that doesn’t yet exist. Can a city that has no organic labor market and no urban precedent attract and retain talent beyond short-term spectacle? By contrast, OHK’s original master plan focused on regional integration—linking inland towns with coastal ports, providing new agricultural valleys with water from the canal, and supporting economic clusters across tourism, logistics, energy, and research. The canal fostered zones of growth rather than a path of disruption. Cities are made of people, not just platforms, and The Line risks overlooking this.
Some may say The Line is a product of techno-futurist renderings more than regional heritage because it lacks any architectural language tied to the Hijazi coast, the Nabatean valleys, or even Bedouin settlements nearby. The city could just as easily be dropped in Mars—or Silicon Valley. This kind of placeless urbanism erases centuries of spatial memory. At best, it’s a blank slate; at its most challenging, it represents a cultural shift. The mirrored walls don’t reflect identity—they change it.By contrast, OHK’s canals-based design incorporated vernacular materials, spatial geometries drawn from oases and forts, and even shaded souqs along the canal banks. This was not nostalgia—it was continuity with land, wind, sun, and story. One entire side of the high-rise cluster is architecturally inspired by vernacular traditions, while our original “mini-Line” serves as a backdrop to a fully developed ensemble of low-rise Tabuk-region villages, built using historical inspirations and housing local populations.
Around the world, top-down mega-projects built without strong local economic or cultural roots have struggled to meet their promises. Ordos Kangbashi in China was designed to house over a million people but opened with an occupancy rate under 20% for its first decade, earning the label of a “ghost city.” Masdar City in Abu Dhabi, planned for 50,000 residents, has fewer than 10% of that population today, functioning more as a business park than a living community. Myanmar’s purpose-built capital, Naypyidaw, stretches over 4,800 km²—six times the size of New York City—yet is home to fewer than 1 million residents, leaving vast empty zones. Even in Saudi Arabia, King Abdullah Economic City was projected to generate 1 million jobs, but after more than a decade it has attracted only a fraction of its target workforce and remains disconnected from surrounding towns. The pattern is clear: when urban megastructures are conceived as spectacle or policy statements rather than as extensions of existing economies and cultures, they risk becoming expensive enclaves with low occupancy, underutilized infrastructure, and little lasting benefit to local communities.
Over 40% of Tabuk’s current employment is rooted in sectors absent from The Line’s vertical urban model. Successful planned cities historically emerge from a strong anchor industry—Detroit’s early 20th-century auto manufacturing or Dubai’s late 20th-century port and trade hubs—before diversifying their economies. In stark contrast, The Line’s projected 380,000 jobs by 2030 hinge on an advanced AI-and-tech sector that today accounts for less than 1% of Tabuk’s economic output, creating a gap between the existing labor market and the promised one that is unprecedented in modern urban planning. Even nationally in Saudi Arabia, the core digital and technology sector contributed just 2.6% of GDP in 2023, while sectors like mining (25%), government services (17%), and manufacturing (13%) were all far larger. Applied to Tabuk’s $29.6 billion metro GDP, the digital-tech economy might account for only about $0.8 billion, or under 1% of the region’s output—underscoring how stark the gap is between the region’s current economic base and The Line’s AI-and-tech-centric job projections.
8. Risk of Becoming a White Elephant—History Says No: Linear Urbanism at 8× Manhattan’s Density Always Breaks Its Line
Many megaprojects fail not in construction but in activation. Once the money is spent, the cranes are gone, and the walls stand tall—what fills the void? A city built for 9 million must attract, house, employ, and retain them. But what if it doesn’t? The risk is that The Line becomes a white elephant: an overbuilt, underused ghost structure requiring massive maintenance without delivering return. Unlike organically grown cities, what would be the fallback industry, the informal sectors, and the cultural magnetism to draw people in over time. Mega-infrastructure with unclear economic underpinnings often becomes a liability, not an asset. That’s why OHK’s original vision was phased, polycentric, and economically diversified.
Throughout history, planners have occasionally imagined cities as linear forms—often guided by a central infrastructure spine such as a river, road, or railway. Yet in every example, these cities eventually broke free from the line, expanding organically outward and forming more complex, multidirectional spatial systems. Take Paris, whose earliest form was organized along the Seine. Over centuries, it radiated out into a series of arrondissements, boulevards, and peripheral centers. Cairo grew along the Nile, but quickly extended perpendicularly into the desert, forming haphazard belts and ring roads. New York City began as a narrow strip at the southern tip of Manhattan—yet even the iconic grid pattern of Manhattan gave way to boroughs and peripheral growth that no longer respected its original axial form. Even railway towns—arguably the closest model to a functional line—eventually developed perpendicular streets, public squares, and secondary centers. Cities grow this way for a reason: life doesn’t move in only one direction.
Linear planning has its place in theory, but never survives in pure form. Humans don’t live only along a line; they live around shared places. In the past, when a city’s linear form became limiting, expansion was simply allowed outward. But what happens when you enclose the line in walls? That’s where The Line becomes challenging. It risks denying the one thing that allowed linear cities to thrive: the freedom to grow outward. Enclosed by mirrored façades, The Line is a spatial dead end. There’s no breathing room, no spillover, no in-between. It’s a closed circuit. The architectural gesture may limit rather than liberate. If past cities grew outward from a line, The Line breaks that historical logic by trapping growth, identity, and people within it.
A population of nine million is on the scale of New York City (8.8 million), London’s metropolitan area (9.5 million), or the entire nation of Austria (9.1 million). In conventional urban form, that number of people typically occupies a vast and varied territory: New York’s five boroughs cover about 780 km², London sprawls over 1,572 km², and the urban footprint of Cairo’s greater metro exceeds 3,000 km². Even in denser Asian megacities like Tokyo, nine million residents in a central ward area are supported by a network of satellite cities, green belts, and industrial zones spread across thousands of square kilometers. By contrast, The Line proposes to fit this same population into a single, enclosed strip just 200 meters wide and 170 kilometers long, a total footprint of only 34 km²—an urban compression without precedent in modern history.
Paris grew from about 500,000 residents in 1800 to over 2 million by 1900, roughly quadrupling in a century. New York expanded from ~500,000 in 1850 to 3.4 million by 1900, tripling in 50 years, but crucially, this was paired with an eightfold increase in land area through annexation and perpendicular expansion. If The Line applied that model, starting from a realistic initial population of 500,000–1 million, it would scale toward nine million over a century or more, with land area growing in proportion—likely from ~34 km² today to 300–800 km² by the time full population is reached. That means the urban form would need multiple perpendicular growth corridors, satellite districts, and green space buffers, not a fixed 200-meter strip.
In density terms, Paris’s densest arrondissements peak at 40,000–50,000 people per km², and Manhattan averages about 27,000 people per km². For The Line to match those sustainable, high-functioning densities, its nine million residents would require 180–330 km² of urban area—five to ten times larger than its planned 34 km² footprint. This would allow for a mix of high-density nodes and lower-density neighborhoods, a diversified economy anchored in multiple districts, and the flexibility to adapt as population, technology, and climate demands shift over time.
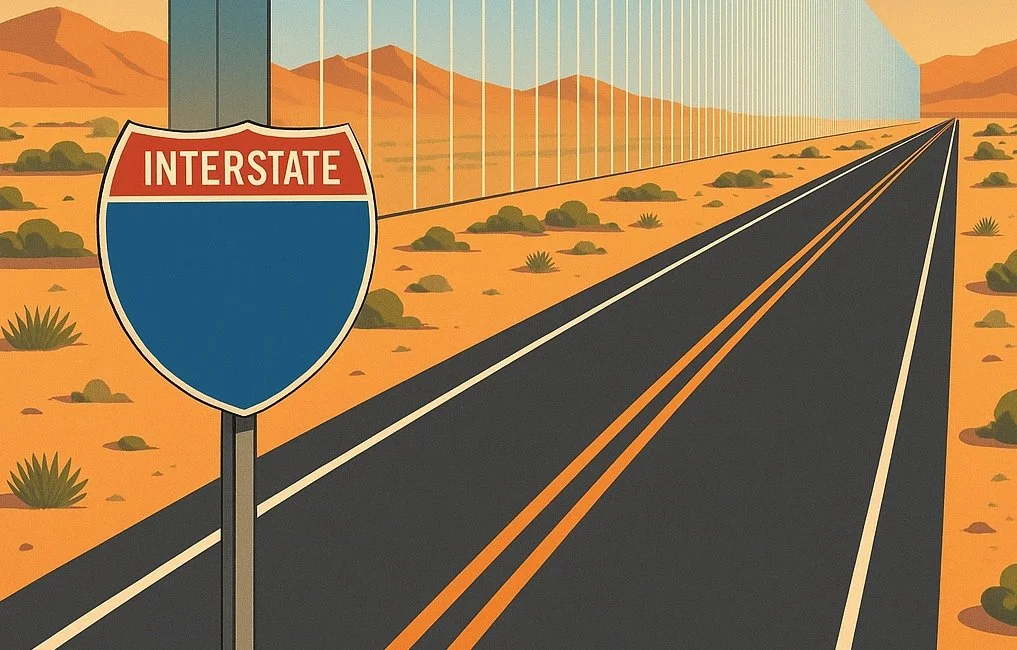
9. Financial Viability: Spectacle Without Return—Costlier Than the US Interstate Highway System in a Single Corridor
Urban megaprojects often face criticism for their cost, but The Line pushes the limits of fiscal logic to new extremes. Its price tag is estimated in the hundreds of billions of dollars, with unofficial projections exceeding $500 billion, and possibly up to $1 trillion when all systems are considered. This dwarfs even the most ambitious urban investments of the 21st century. Consider Dubai’s Burj Khalifa, often cited as the poster child of “vanity urbanism.” The tower cost around $1.5 billion to build—an enormous figure at the time. And while the Burj itself may not have delivered direct profits, it succeeded in its strategic purpose: anchoring the Downtown Dubai district, catalyzing billions more in surrounding development including the Dubai Mall, fountains, hotels, and residential towers. In short, it acted as an economic activator.
By contrast, The Line lacks this catalytic logic. It is not an anchor to surrounding growth; it is a sealed-off, self-contained corridor with no external catchment. The cost of just the mirrored façade—500 meters tall and 170 kilometers long—has been estimated by OHK at well over $100 billion, depending on material and installation logistics. That’s 60x the cost of the entire Burj Khalifa, just for the cladding. And this is before considering: tunneling for high-speed underground transit, vertical logistics systems, complete climate-controlled environments, desert infrastructure for energy, water, and waste, and phased development over unproven timelines
There’s also a deeper risk: The Line is a “use it or lose it” model. Either it fills with millions of residents and businesses quickly, or it becomes a stranded asset—draining state funds with no return. There’s no surrounding urbanism to buffer it. It’s all or nothing. The Line feels like a fiscal uncertainty — a bold vision without a clear investment case. In real cities, vision matters, but viability remains essential. By contrast, entire cities such as Songdo in South Korea and Lusail in Qatar came in at $40 billion and $45 billion respectively, while the high-profile Masdar City in the UAE cost $22 billion. The disparity is striking: the façade of The Line alone could fund multiple large-scale urban developments elsewhere. Whereas the Burj Khalifa anchored a profitable and vibrant district, The Line’s sheer cost, even in partial form, raises significant concerns about viability and the clarity of its investment rationale.
If built to its full specifications, as announced, The Line’s total projected cost could exceed the inflation-adjusted cost of some of history’s most ambitious infrastructure undertakings. The US Interstate Highway System, which spans over 75,000 kilometers and transformed an entire continent’s mobility, cost about $558 billion in today’s dollars. For context, far from being a sunk cost, it generated a return on investment estimated at 15–25% annually for decades, contributing more than $6 trillion to US GDP between 1950 and 1990 by reducing transport costs, unlocking suburban and industrial expansion, and integrating regional economies. Every $1 spent produced at least $6 in long-term productivity gains across an entire continent. By comparison, The Line’s projected full cost—up to $1 trillion—would be concentrated in a single 170 kilometer corridor, with no continental-scale freight network, agricultural hinterland, or nationwide connectivity to generate similar spillover benefits. This stark disparity underscores the fiscal risk: The cheaper US Interstate Highway System rewired an economy, while The Line must justify a greater per-kilometer spend with returns generated almost entirely inside its mirrored walls.
The Three Gorges Dam in China, the world’s largest power station by installed capacity, came in at roughly $37 billion. Similarly, the Channel Tunnel between the UK and France, which cost approximately $21 billion in today’s terms, has consistently generated hundreds of millions of dollars in annual revenue from freight and passenger operations, despite debt challenges in its early years. Even the International Space Station, assembled in orbit over two decades and representing the combined efforts of five space agencies, cost around $150 billion. The Line, as a single enclosed urban corridor in one region, could surpass all of these individually and potentially collectively—and in the case of the façade alone, exceed the entire ISS budget. The façade, by contrast, offers no direct revenue stream; it is an aesthetic and branding choice with enormous capital implications. In transport infrastructure, return is often built into the business case. The Hong Kong–Zhuhai–Macau Bridge, with a cost of roughly $20 billion, is backed by toll revenues and intercity freight benefits that will operate for decades. The Line, by contrast, requires residents and businesses to relocate en masse for its economics to work—and those revenues, primarily from real estate sales and service charges, depend entirely on full-scale occupancy from day one. Without the ability to capture diversified income streams from logistics, transit, or industry, the project faces a far narrower and riskier path to financial sustainability than these global precedents.
Ultimately, The Line’s financial gamble lies in attempting to achieve world-record costs without world-record revenue models. Where history’s most expensive infrastructure projects built in mechanisms for steady, diversified returns—whether in tolls, trade, energy production, or freight—The Line concentrates its economic fate on an immediate and sustained influx of residents and tenants into an entirely new, untested urban form. If that uptake falters, there is no fallback sector, no external economic engine, and no regional network to absorb the shock. In this sense, The Line is less a high-risk investment with upside potential and more a binary bet: total success or colossal write-off, with little precedent in modern urban development for a middle ground.
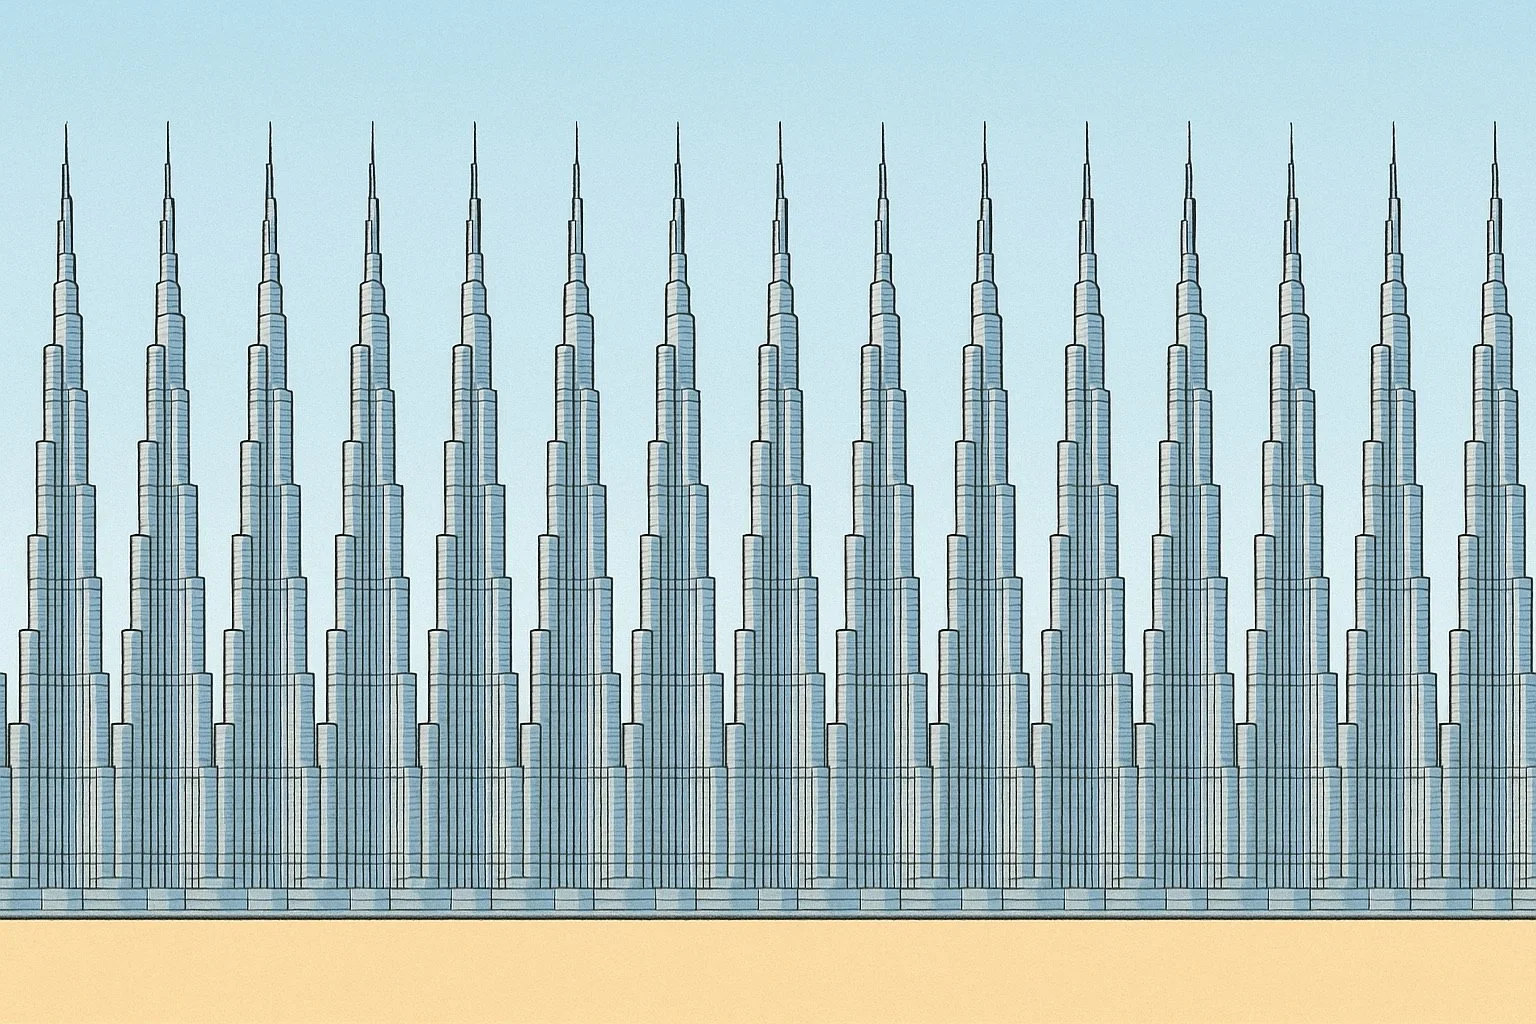
10. Safety and Emergency Response Challenges in a Linear City—Evacuation Demand Equivalent to 700 Burj Khalifas
The Line’s unconventional design raises significant questions about public safety and emergency response. By concentrating residents and infrastructure within a sealed, hyper-dense corridor, it limits the number of access and exit points available in the event of an incident. In a conventional city, emergency services must approach buildings from multiple directions, establish safe perimeters, and make use of diverse evacuation routes. The Line’s form, however—a sheer mirrored wall with a footprint only 200 meters wide but stretching 170 kilometers—creates logistical challenges. Fire crews and emergency teams would be required to travel long distances along a single axis, while evacuation would need to occur either vertically or linearly, with few opportunities for alternative paths. Reliance on underground high-speed rail systems for internal transit could also pose risks if these enclosed routes were compromised by smoke, flooding, or structural failure.
Real-world incidents highlight the importance of redundancy in urban design. The Grenfell Tower fire in London in 2017 demonstrated how building cladding and vertical fire spread can amplify danger, while the events of September 11 in New York showed how even multiple stairwells could not fully offset evacuation delays in very tall structures. Tunnel fires, such as the Mont Blanc disaster in 1999, illustrate the challenges of containing and escaping from enclosed transit routes. Traditional cities mitigate these risks through networks of roads, varied building heights, and multiple access points, allowing incidents to be isolated and addressed locally. The Line’s continuous, linear form removes much of this redundancy, meaning that a major incident in one section could have cascading effects across the entire system. By contrast, the modular, open-access cluster model proposed in OHK’s canals-based NEOM plan was designed to localize and contain emergencies. This approach allows responders to access affected areas from different directions, while keeping the broader system functional and safe. In dense urban development, flexibility and redundancy are not luxuries—they are fundamental to resilience.
Let’s get technical here for a few paragraphs. Designing a linear megastructure to U.S. life-safety benchmarks quickly shows the scale of what’s required. Under the International Building Code (IBC) and the International Fire Code (IFC), egress capacity is sized at about 0.30 in/person for stairs and 0.20 in/person for level paths; even a “vertical neighborhood” of 10,000 occupants would need roughly 250 feet of total stair width and 167 feet of level egress width distributed across multiple, remote exits. Using IBC Chapter 10 egress capacity factors, a practical way to size systems is by the US National Fire Protection Association (NFPA) 130 exit-spacing module of ~762 m (2,500 ft). Over 170 km, that yields ~223 emergency exit “segments.” Each segment would serve on the order of ~40,000 residents (9,000,000 ÷ 223 ≈ 40,300). At IBC capacities, that single 762-m segment would require roughly 12,100 inches of total stair width (≈1,009 ft) and ~8,070 inches of level egress width (≈672 ft), distributed among multiple, remotely located stairs and corridors. Put differently, if stairs are ~5 ft clear each, that’s on the order of ~200 separate stairs per segment—illustrative only, but it shows the magnitude of redundancy you’d need to maintain code-level flow in a linear, high-rise environment.
Let’s dig deeper, for the below-grade transit spine, NFPA 130 sets two key controls: (1) clear the platform occupant load in ≤4 minutes, and (2) provide exits at ≤2,500 ft (~762 m) or cross-passages at ≤800 ft (~244 m) when used in lieu of full exits. Applied to a 170-km guideway, you’re looking at ~220+ emergency exits and ~700 cross-passages along the corridor just to meet spacing—not yet counting additional locations driven by station geometry, grades, or local risks. Evacuation performance must then be demonstrated by calculation/simulation to meet the ≤4-minute platform-clearance criterion. For tunnel safety, NFPA 502 mandates performance-based smoke control, with ventilation plants at roughly 1.5–2.0 km intervals. Over 170 km, this equates to 85–113 ventilation stations per tube, or 170–226 for a twin guideway. If each tube used ~8 jet fans per km, the system would require ≈2,700 fans along with smoke curtains, dampers, and dedicated emergency power at every sector. High-rise pressure zoning (per NFPA 14 and NFPA 20) would divide each 500 m vertical section into 7–8 pressure zones, each with at least two fire pumps for redundancy—≈14–16 pumps per 762 m segment or around 3,500–3,600 pumps in total.
Why this matters? All of the above is achievable in principle, but the repetition density at linear-city scale is extraordinary. The engineering challenge isn’t any single requirement—it’s maintaining redundancy and sectionalizing failures across 170 km so that an incident remains local, not systemic. Bottom line: none of this is impossible, but applying standard U.S. code math at The Line’s advertised scale drives extraordinarily dense, repeated life-safety infrastructure—making redundancy and sectionalization the core design (and cost) challenge rather than a nice-to-have.
Let’s add comparative evacuation density metrics that show just how unprecedented The Line’s life-safety scale would be. For example, the Burj Khalifa, at 828 meters tall, serves roughly 12,000 occupants and requires about 35 feet of total stair width to comply with international codes. By proportion, a single 762-meter segment of The Line, housing more than 40,000 residents, would require almost thirty times that stair width. This comparison makes clear that while the Burj represents one of the world’s most challenging vertical evacuation cases, The Line would replicate and multiply such complexity hundreds of times along its length. Another useful layer is travel time for emergency services. Even with dedicated emergency lanes, a fire truck or ambulance dispatched from the midpoint of a 170-kilometer corridor would take more than an hour to reach an incident at the farthest end, assuming ideal conditions with no congestion, system failures, or access obstructions. In conventional cities, multiple radial and ring routes allow responders to approach from various directions; The Line’s singular form removes this flexibility, greatly increasing vulnerability to delays.
The scale of maintenance and inspection also changes drastically at this size. If each of the 223 emergency exit segments required a quarterly evacuation drill, that would mean nearly 900 drills per year, without yet counting the 85 to 113 ventilation plants and roughly 3,500 pump systems that would each demand regular testing and certification. Life-safety readiness in The Line would be a constant, year-round operational commitment on a scale no city has ever attempted. From a financial perspective, applying industry benchmarks to these systems suggests another layer of cost pressure. Emergency stair construction, NFPA-compliant smoke ventilation plants, and high-rise pump systems have well-documented per-unit costs. Replicating these at the density required along 170 kilometers could add $20–30 billion to the life-safety budget alone, before ongoing operational staffing is even considered. In effect, redundancy at The Line’s scale is not just a design feature—it is a massive parallel infrastructure system with its own capital and operational footprint. Finally, even the modeling required to validate such a system would be unprecedented. Evacuation simulations for skyscrapers, stadiums, or transit hubs typically involve thousands to tens of thousands of occupants in bounded geometries. The Line’s continuous corridor would require modeling millions of occupants and hundreds of egress points, turning life-safety planning into a megaproject in its own right. In other words, the challenge is not that any single safety requirement is unachievable—it is that multiplying them by the corridor’s length, density, and verticality transforms each standard into a monumental engineering and operational burden.
From a pure impact scale, the numbers are staggering. The Line’s projected 9 million residents would rival the population of Tokyo’s city proper, yet instead of being distributed over a traditional urban footprint of hundreds of square kilometers, they would be confined within a corridor just 200 meters wide and 170 kilometers long. In traditional megacities, population is spread across multiple districts with independent utility grids, decentralized transportation hubs, and localized governance, allowing failures to be contained. In The Line, a cyberattack, AI malfunction, or software bug could disable the entire system at once, leaving no unaffected districts to provide relief. To illustrate the fragility of such a configuration, imagine a cyber incident on the scale of the 2017 WannaCry ransomware attack, which infected over 200,000 systems in more than 150 countries. In most affected cities, disruption was partial—certain hospitals, transport operators, or corporate offices were offline, while the rest of the city continued to function. In The Line, the same digital breach could disable all transport, HVAC, elevators, and emergency systems in one move, instantly affecting every resident. This level of systemic vulnerability has no precedent in modern urban planning, because no other city concentrates its life-support infrastructure into a single, interdependent digital spine.
Adding to the stakes, the corridor’s ultra-high density means any prolonged outage would escalate rapidly. Without climate control, temperatures in interior spaces could surpass human tolerance in under six hours in peak summer heat, a lethal environment for vulnerable populations. Elevators serving vertical neighborhoods could leave tens of thousands stranded above ground level, and underground transit stoppages could trap passengers in confined tunnels with limited ventilation. Even modest delays in restoring service—measured in hours rather than days—could tip the city into a full-scale humanitarian emergency. Historical infrastructure failures in traditional cities underscore how dangerous such systemic dependency could be. In New York’s 1977 blackout, which lasted 25 hours, much of the city descended into chaos, but surrounding regions and unaffected boroughs could supply aid, evacuate residents, and maintain basic governance. In contrast, The Line’s sealed, contiguous corridor offers no such relief valves—if its central systems fail, the outage engulfs every neighborhood simultaneously. India’s 2012 grid collapse, which left over 600 million people without power, was mitigated by the geographic dispersal of cities and villages, allowing some unaffected zones to help restore stability. In The Line, geographic dispersal does not exist; a single point of failure in its digital backbone could instantly incapacitate all nine million residents with no external fallback.
11. Technological Dependency and Fragility: Nation Scale at the Mercy of Code—Where a One-Week Shutdown Could Erase 15% of Hungary’s GDP
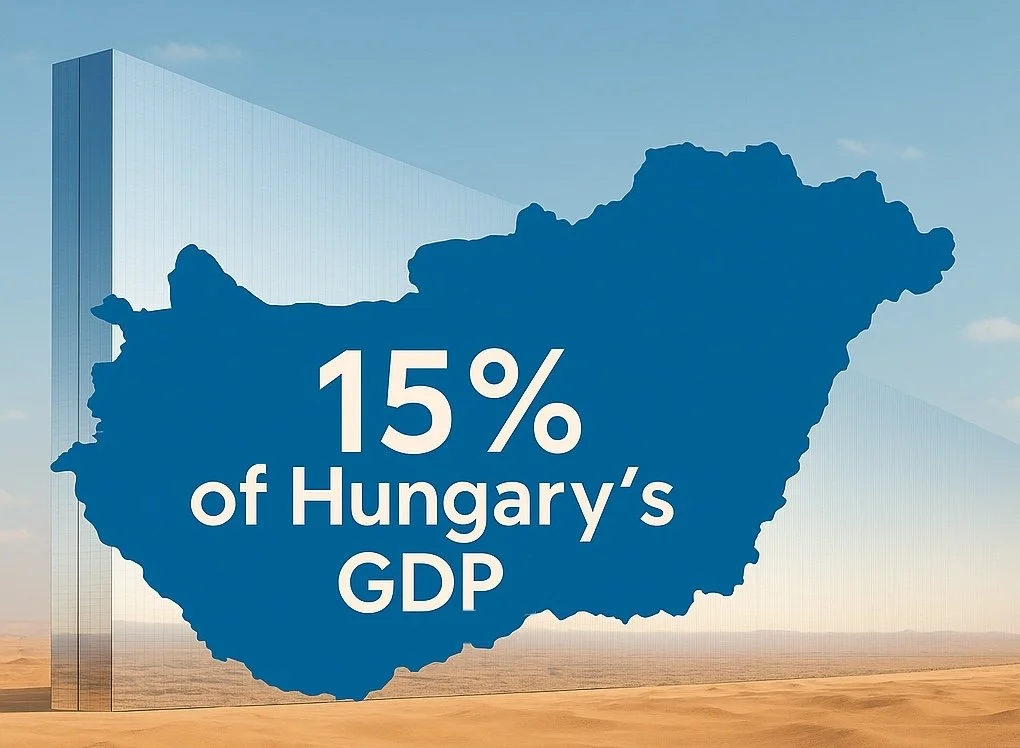
At the core of The Line’s vision is a total reliance on advanced technologies: real-time data flows, AI-driven mobility, automated climate control, facial recognition systems, predictive governance algorithms, and fully integrated digital infrastructure. While this may appeal to tech futurists, it represents an unprecedented level of urban fragility. Instead of building resilience into the physical and social fabric of the city, The Line outsources it all to a digital nervous system. In practical terms, this means that the failure of any major subsystem—be it water delivery, ventilation, vertical mobility, or waste management—could have instantaneous, cascading consequences across the entire 170-kilometer corridor. When your transportation, power grid, and air conditioning are all controlled by centralized AI, you are no longer managing a city—you are operating a giant, interconnected device. Now layer on the reality of cybersecurity threats.
Cities across the world have faced ransomware attacks, grid shutdowns, and hacked emergency services, but most have analog redundancies. In 2021, Colonial Pipeline in the United States was hit by ransomware, disrupting fuel supply across the East Coast; while digital systems were locked, manual valves and analog operations allowed partial restoration. In 2018, Atlanta suffered a major ransomware attack that crippled court systems, utility payment portals, and police records, but paper-based processes kept critical services running. In 2020, New Orleans declared a state of emergency after a cyberattack forced systems offline, yet analog radio systems and manual dispatch protocols kept emergency response functional. Even in Ukraine, where grid cyberattacks in 2015 and 2016 temporarily shut down power, manual breakers and on-site crews restored electricity within hours. In The Line, there may be no traditional intersections, backup generators on separate networks, or civic departments that function independently. A single coordinated cyberattack—state-sponsored or otherwise—could paralyze the entire city, with no horizontal grid to fall back on and no room to maneuver.
Moreover, The Line is located in a region with persistent geopolitical instability. While Saudi Arabia is rapidly modernizing, the Middle East remains a high-risk environment where state-sponsored cyberwarfare, such as that seen in the long-running Iran–Saudi tensions, is a constant possibility. Symbolic infrastructure in the region has historically attracted terrorist targeting, while proxy conflicts have the potential to spill over into deliberate digital sabotage. In an urban system so dependent on centralized control, even a single successful cyberattack on The Line’s core operating systems could have cascading and immediate consequences: elevators could seize up, trapping thousands in vertical towers; climate control could fail, transforming interiors into dangerously overheated or unlivable spaces within hours; emergency response systems could freeze mid-incident; the underground transit grid could halt abruptly, stranding passengers in confined tunnels; and personal data for millions could be exposed to hostile actors.
These risks are not speculative—they follow an established pattern seen in major cyber incidents around the world. The Stuxnet cyberweapon demonstrated how targeted code could physically damage critical infrastructure when it was used to sabotage Iranian nuclear centrifuges. The Shamoon virus wiped the computers of Saudi Aramco, one of the world’s largest energy companies, in a politically motivated attack. These examples all involved discrete, limited systems—none attempted to disable every element of a city simultaneously. The Line if proposes exactly that vulnerability: a place where every control system, every amenity, and every safety feature is integrated into a unified software environment with no physical fallback. You’re not just putting nine million people in a building—you’re putting them inside a software stack. The planning model must integrate digital systems without sacrificing physical logic. In our NEOM original concept, vital infrastructure was decentralized, walkable zones were prioritized, and analog backups were embedded in every district—ensuring continuity even if advanced systems failed. That is what resilience looks like. The Line promises control and precision, but in engineering terms, control without redundancy is brittle. And when brittle systems fail, they don’t bend—they shatter.
The potential economic consequences are equally extraordinary. If we take conservative benchmarks from major economic capitals—London generates about $730 billion GDP annually, New York about $1.8 trillion, and Paris about $850 billion—The Line’s planned density suggests an urban GDP potentially in the range of $1.5–2 trillion annually. Using this baseline, every single day of downtime could theoretically erase $4–5.5 billion in economic output, and an extended failure of just one week could wipe out more economic value than the 15% of the annual GDP of a country like New Zealand or Hungary. In a world where ransomware attacks on municipalities have demanded ransoms as low as $50,000 to as high as $70 million, the disparity between the cost to cyber attackers and the potential cost to the city could make The Line the most tempting cyber target in history.
12. Maintaining the Mirror: The Operational Challenge of The Line’s Façade – Equivalent to Building Two Burj Khalifas Annually
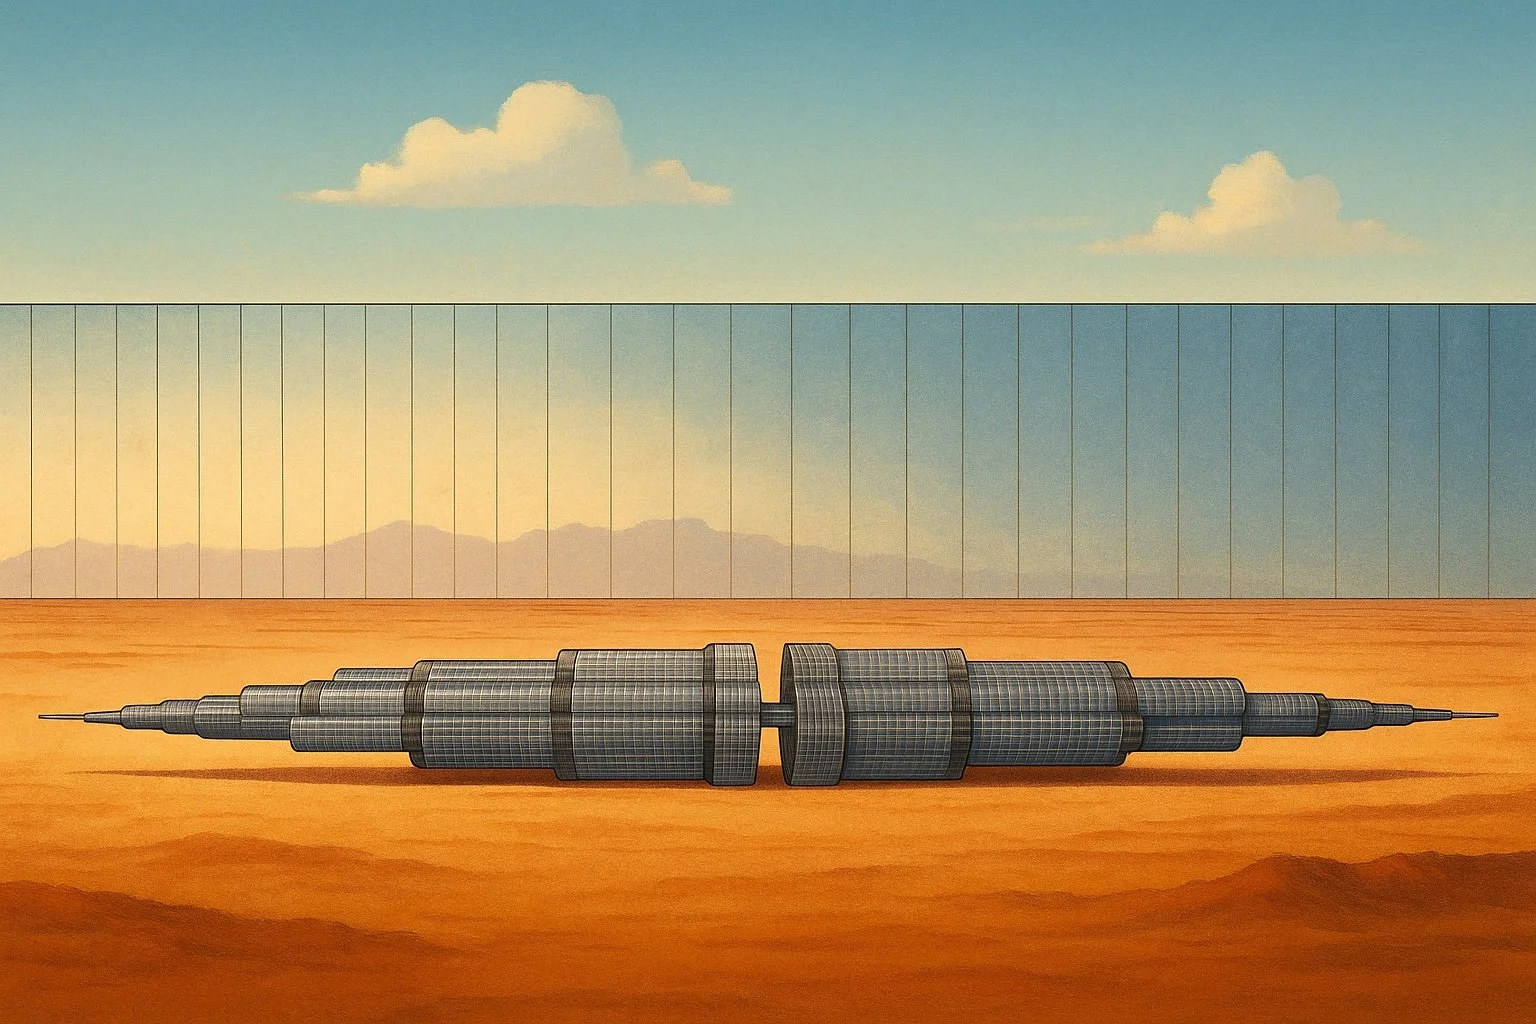
One of the lesser-discussed aspects of The Line’s design is its long-term maintenance, particularly the challenge of cleaning its mirrored façade. The project proposes 170 kilometers of mirrored glass walls, each 500 meters tall on both sides, situated in the Tabuk region of Saudi Arabia—an area known for high winds, frequent sandstorms, and fine dust that quickly accumulates on surfaces. In tall building operations worldwide, glass façade maintenance is already among the most costly recurring expenses. For example, the Burj Khalifa in Dubai, at 828 meters tall, requires around 120 workers and specialized mechanized platforms to clean its 26,000 glass panels, a process that takes three months and costs roughly $1.5 million. The Line would multiply this challenge many times over. At roughly 200 times the Burj Khalifa’s length, and with both sides mirrored, The Line would present approximately 340 kilometers of vertical glass façade—equivalent to about 85 million square meters of surface area. Using industry averages of $5–10 per square meter annually for façade cleaning, the estimated cost to keep the mirrors clear would range from $425 million to $850 million per year. Achieving this would likely require constant, automated cleaning systems such as robotic drones or gantry mechanisms, a dedicated supply of desalinated water to prevent streaking, and maintenance crews supported by AI diagnostics to monitor damage and dust accumulation. Additionally, the façade would require ongoing replacement of glass panels due to wind-blown sand erosion, thermal expansion cracking, and occasional mechanical failures.
Getting technical again, we can estimate the ongoing cost of replacing façade panels on The Line by breaking down the numbers. The total mirrored façade area is roughly 85 million square meters (170 km long × 500 m tall × two sides). If we assume an industry-standard large insulated glass unit (IGU) panel size of 1.5 m × 3.0 m—about 4.5 square meters each—that means The Line would have approximately 18.9 million individual panels. In a desert environment with high winds, intense UV exposure, and extreme temperature swings, annual replacement rates from sand erosion, thermal cracking, seal failure, and mechanical damage could reasonably range from 0.5% to 2% of the total surface area. At the low end of that range (0.5%), around 425,000 square meters of glass would need replacing each year—roughly 94,000 panels ( ~5x Burj Khalifa’s panels). At 1%, the figure doubles to 850,000 square meters or about 189,000 panels. At 2%, the number jumps to 1.7 million square meters or 378,000 panels annually. Using an installed replacement cost of $800–$1,200 per square meter—a realistic range for tall, high-access mirrored glass in challenging climates—the annual replacement cost would be $340–$510 million at 0.5%, $680 million–$1.02 billion at 1%, and $1.36–$2.04 billion at 2%. From a logistical standpoint, if one specialized crew or robotic unit could safely replace about four panels per day and work 300 days per year, that’s 1,200 panels annually per unit. At the 1% replacement rate (~189,000 panels per year), this would require around 160–170 crews or units operating simultaneously along the corridor. At 2%, that figure rises to 315–330 units. Keeping a strategic stockpile of 1–2% of the total panel count would mean storing 190,000–380,000 panels—equivalent to 850,000–1,700,000 square meters of glass—along with mounting hardware, crates, and climate-controlled storage.
The Line could face a recurring annual outlay in the billions solely for glass replacement, even before factoring in additional expenses for warehousing, quality control, night-work premiums, traffic management on service decks, waste disposal, and environmental compliance—items that could add another 10–20% to the total. Taken together, the scale and complexity of façade maintenance would constitute an ongoing megaproject in its own right. While the mirrors are intended to project an image of precision and technological advancement, their upkeep would represent one of the most resource-intensive façade maintenance efforts ever undertaken. Urban environments tend to thrive when their infrastructure is robust and can be sustained efficiently over time. Designing a city whose visual integrity depends on constant large-scale cleaning introduces operational, environmental, and financial challenges that would require extraordinary long-term commitment. The Line’s striking appearance may be achievable, but its preservation would demand resources and systems on a scale rarely seen in urban maintenance.
The Line would be spending the equivalent of building two Burj Khalifas annually, not to expand the city, but simply to keep the façade clean and functional. To put this into a broader context, $1.87 billion is larger than the annual budgets of some small nations and comparable to what mid-sized cities spend on all municipal services combined.
13. Let’s Talk about AI in The Line: 6% of Dubai’s Entire Peak Electricity Demand or 20% the Consumption of Google’s Global Data Center Fleet
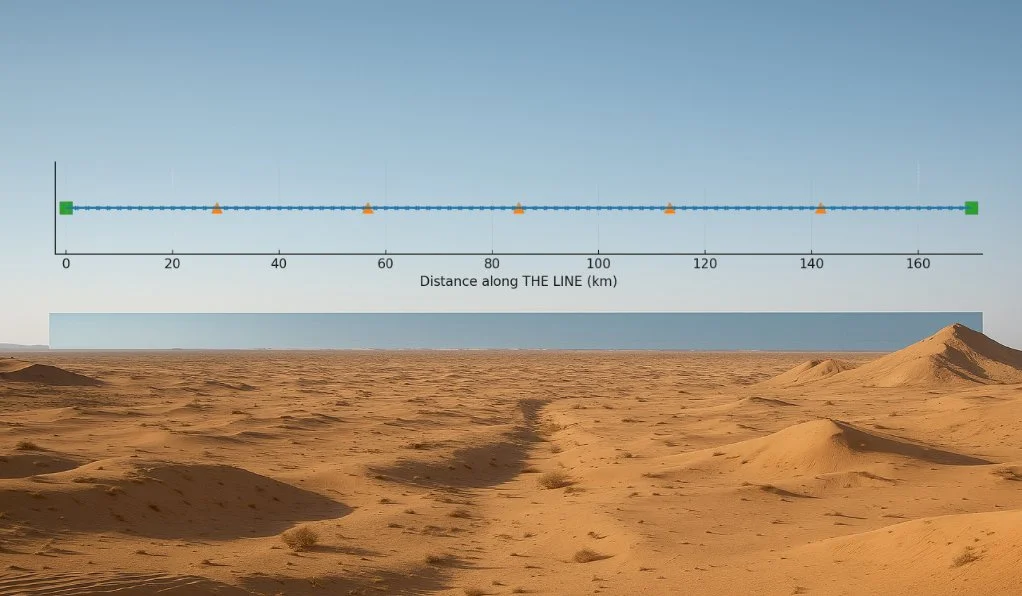
If The Line’s entire 170 km length were operated by AI, it would require a multi-tier network of data centers combining 85–170 edge micro data centers (MDCs) (compact, container-sized facilities placed close to sensors and devices for real-time processing) spaced every 1–2 km for instant control, 4–6 regional campuses (medium-sized data centers serving 30–40 km zones, handling localized analytics and caching), and 1–2 hyperscale core campuses (large-scale centralized facilities housing tens of thousands of servers for AI model training, large data storage, and citywide optimization). Using current AI rack densities (the amount of power a single rack of servers draws, typically 60–100 kW in advanced AI setups) and best-practice efficiency (measured by PUE — Power Usage Effectiveness, with 1.15 meaning only 15% of energy is lost to cooling and other overheads), the city would consume between 300 MW at minimal scale to over 1.4 GW at maximum ambition, with a balanced scenario near 690 MW at-the-wall (total facility power draw, including IT load and overhead). For perspective, this balanced scenario is about ~6% of Dubai’s entire 2024 peak electricity demand and roughly 17–22% of Google’s global data center electricity consumption (based on 2024 and 2023 reports, respectively). Environmentally, this would still place The Line among the largest concentrated AI power users in the world, rivalling the total hyperscale footprint of countries like Ireland or Singapore, both of which have faced grid strain and policy restrictions due to data center growth.
Financially, with construction costs averaging $8–12 million per MW of IT load (the computing portion of a data center’s power use) for hyperscale builds—slightly less for MDCs and slightly more for advanced cooling—the balanced ~575 MW IT load scenario could require $4.6–6.9 billion in capital expenditure, excluding the cost of building renewable energy capacity. Operating costs, mainly electricity, could range from $267–534 million annually if bought at commercial grid rates without renewable offsets. To mitigate environmental impact, integration with NEOM’s planned green hydrogen production (using renewable electricity to split water into hydrogen for clean storage and energy release) and high-renewables grid would be essential, as would scheduling AI training workloads during solar and wind peaks and using advanced liquid cooling (coolant directly circulates through server components, far more efficient than air) with heat recovery. Without such measures, backup reliance on fossil fuels could result in millions of tonnes of CO₂ annually, making sustainability measures central to the project’s viability.
This schematic above illustrates the proposed balanced distribution of AI data centers along THE LINE’s 170 km route. Blue dots represent Edge micro data centers (MDCs) positioned roughly every 2 km, orange triangles mark Regional campuses located about every 30–40 km, and green squares indicate the Hyperscale core campuses at each end. Together, these three tiers deliver localized responsiveness, zonal processing, and centralized computing power—balancing performance, redundancy, and infrastructure efficiency without overextending the network.
A More Likely Future: The Line as Icon, Not City—OHK’s Alternative Vision of Canals and the Logic of Place
At OHK, we don’t believe The Line will vanish. Instead, we believe it will shrink—probably to the scale proposed in our “mini-Line” (3–4 km) if the height is reduced and the design is reimagined, and likely to less than a third of that (1–1.5 km) if it is kept at its current height. Like many megaprojects throughout history, its final form will likely be a fragment of the original vision, repurposed as a symbolic structure within a more conventional urban landscape. For example, Crystal Island in Moscow, designed by Foster + Partners, was announced in 2007 as the largest structure in the world, covering an astonishing 27 million square feet under an iconic tent-like form and expected to cost around $4 billion. It was to house residential, commercial, and cultural spaces for 30,000 people. However, the 2008 global financial crisis halted the project entirely, and while some related developments proceeded elsewhere in Moscow, the landmark structure itself was never built. Another example is Masdar City in Abu Dhabi which followed a similar trajectory: launched in 2006 as a $22 billion plan for the world’s first fully zero-carbon city accommodating 50,000 residents and 40,000 commuters, it aimed to be powered entirely by RE with advanced waste and transport systems. Budget pressures and shifting policy priorities had scaled the vision back to less than 10% of its original physical footprint, with the built portion functioning primarily as a tech and research hub rather than a self-contained city. Songdo International Business District in Incheon, South Korea, initially planned in the early 2000s as a $40 billion “smart city of the future” covering 6 million m², also underwent quiet reductions in scope. While it achieved much of its infrastructure and office development, several of its more experimental elements—such as full-scale pneumatic waste systems across all districts, fully automated transport fleets, and complete LEED certification for every building—were dropped or limited, and the city’s final form is more conventional, blending futuristic planning with standard urban development patterns.
Rather than housing 9 million people in a mirrored corridor, The Line may become a singular icon—an architectural marvel akin to the Burj Khalifa or the Eiffel Tower—anchoring a district of lower-rise, more traditional developments. The very thing that makes The Line untenable as a city may, ironically, make it compelling as a centerpiece. If we use the Burj Khalifa’s cost ($1.5 billion) as a benchmark for a “statement” skyscraper, then only ~1.5% of The Line’s proposed length could be justifiably built if its role were simply that of a symbolic anchor. That means: The Line should be no longer than ~2.5 kilometers. At that length, it becomes comparable in ambition to Hudson Yards in NYC, or the Dubai Creek Tower district—still bold, still visionary, but grounded in the logic of viability and real-world city growth. And unlike the image of a sealed mirrored corridor in the desert, this new Line could be: a climate-controlled innovation zone, a university or tech hub, a residential-commercial mix with panoramic views, and a visitor destination, much like the Burj. Around it, real streets, ports, transit systems, and neighborhoods could take shape—the city NEOM still needs, not the one trapped in renders. This is not failure. It’s correction.
OHK’s original master plan for NEOM, submitted in the early conceptual phase of the project, proposed sea canals slicing through the desert from the Red Sea toward the interior. The goal wasn’t symbolism—it was function. The canals were a spatial, ecological, and economic engine. Spatially, they anchored a region of interconnected towns, ports, research hubs, and tourism zones. These were not stacked vertically or forced into a single line, but arranged around climatic, topographic, and logistical advantages. Environmentally, the canals served as cooling spines. Passive design principles allowed winds from the sea to flow through urban clusters. Water features improved humidity and shade zones. The canal also enabled small-scale agriculture, local fisheries, and aquatic mobility. Economically, it brought diversification. Maritime shipping routes, port logistics, tourism marinas, research stations, and aquaculture zones created employment far beyond the digital utopia envisioned by The Line. The canals’ approach acknowledged scale, climate, heritage, and risk. It could be phased. It could grow. And most of all, it respected the logic of the land—not because it was less ambitious, but because it was more grounded. NEOM sits at the crossroads of key Red Sea shipping lanes, yet The Line turns its back on this advantage. A linear city 170 km inland has no meaningful port strategy, no dockyard-based economy, and no integration with Red Sea logistics. This is a missed opportunity. A canal not only can cool the region, it creates maritime access, fostering industries like aquaculture, shipping, and coastal tourism.In a century where waterways rival tech infrastructure in importance, sidelining maritime integration is a strategic gap. Rather than pursuing spectacle, OHK’s canals’ plan pursued longevity.
We will conclude Part 1 here, having examined the scale, challenges, and evolving realities surrounding The Line. In Part 2, we will turn our focus toward solutions—bringing to the forefront concepts and innovations developed by OHK in its original NEOM design. These proposals are rooted in the region’s environmental, cultural, and economic context, and they aim to balance ambition with feasibility. We will explore how OHK’s approach integrates sustainable infrastructure, adaptive architectural strategies, and human-scaled urbanism to create spaces that are both forward-looking and grounded in place. By drawing on our earlier work for NEOM, we will present options that retain the visionary spirit while addressing the practical constraints of construction, energy use, and long-term livability. This next section will demonstrate how thoughtful design evolution can transform bold concepts into viable, resilient, and contextually rich urban realities for Tabuk and the wider region.
Part 2 will reveal how OHK’s original NEOM design transforms visionary ambition into practical, sustainable, and contextually grounded urban realities.
A team from OHK Consultants developed the first concept of NEOM, bringing together bold vision and grounded feasibility in one of the most ambitious urban projects of our time. As a hybrid consulting firm, we combine management consulting, spatial planning, and international development into a unified practice that spans sectors and disciplines. Our expertise extends across land policy, infrastructure investment, and governance reform, but it is our management consulting ethos that binds it all together. This ethos informs everything we do—from designing spatial and economic strategies to advising on institutional reform—ensuring that accountability, transparency, and human impact are embedded in every project. We help governments, development institutions, and private sector leaders navigate ethically complex environments while upholding international norms and delivering long-term social value. Contact OHK to learn how our planning capabilities can help you make better city, urban, and data-driven decisions.