

A Framework for Oil Pricing in the Wake of the Strait of Hormuz Crisis
OHK maps how disruption, logistics, insurance, reserves, and policy combine to produce a range of credible oil-price outcomes.

Oil markets are often discussed as though they can always be reduced to a number. What will Brent be next week, next month, or by the end of the year? In ordinary times, that question is already difficult. The Strait of Hormuz is not simply another market variable. It is a narrow passage through which physical supply, shipping confidence, insurance behavior, strategic reserves, military risk, and political signaling all pass at once. When that passage is disrupted and normal commercial transit is no longer functioning reliably, the market is no longer pricing only oil fundamentals. It is pricing competing scenarios about disruption, resilience, escalation, mitigation, and reopening. We begin from a simple but important premise: in such an environment, the goal of forecasting is not to produce a magical single number. It is to build a disciplined framework that separates baseline oil value from crisis distortion, translates physical stress into market impact, and helps decision-makers understand what range of outcomes becomes plausible under changing assumptions. That is the purpose of the work presented here. It is not an attempt to eliminate uncertainty, because uncertainty is part of the object being studied. It is an attempt to organize that uncertainty in a way that is analytically credible, operationally useful, and clear enough to support governments, investors, and strategic planners facing one of the world’s most sensitive energy chokepoints during a period of active disruption. This is not only about Brent, but also about inflation, procurement, reserve management, import dependence, and infrastructure planning.
Reading Time: 40 min.
All illustrations are copyrighted and may not be used, reproduced, or distributed without prior written permission.
Summary: This article argues that oil pricing during the Hormuz crisis cannot be understood through ordinary point forecasting alone. In a live chokepoint disruption, baseline oil-market drivers are overlaid by outage risk, shipping delays, war-risk insurance, rerouting constraints, reserve releases, and shifting probabilities of escalation or reopening. The article therefore proposes a layered scenario framework rather than a single target price. It reviews the main families of oil-price models, explains why none is sufficient on its own in a live Hormuz crisis, and presents the OHK Hormuz Oil Stress Model as a decision-support system designed to translate physical disruption into conditional price ranges. The overall arc is: normal oil forecasting logic versus wartime chokepoint reality → Hormuz as a breakdown of point-forecast thinking → the disruption as the moment that forces a methodological reset → quantified stress test of outage, insurance, freight, rerouting, and reserve assumptions → benchmark comparison against institutional model families and market pricing → broader implications for how oil forecasting must move from point prediction toward scenario architecture.
Chronology Note: the OHK model is live-anchored to March 12, 2026, while later market movements in early April are used only as subsequent validation points rather than as part of the original model date. March 12, 2026 = model anchor date and April 2–3, 2026 = later validation / escalation evidence.
Note: Readers can also consult OHK’s article on Why and How the World Still Runs Through the Strait of Hormuz: The Infrastructure It Never Built here, for a broader examination of the chokepoint, its global significance, and the infrastructure gaps that left the world so exposed.
Why Point Forecasts Fail in War and Chokepoints: Why Hormuz Requires a Scenario System, Not a Magic Number

The first and most consequential mistake in oil forecasting during a chokepoint crisis is to assume that oil still behaves like a normal macro variable when war is reshaping the transport system beneath it. In ordinary periods, it is tempting to ask for a single number: What will Brent be next week? What will Brent be next quarter? But the Strait of Hormuz is not an ordinary variable. It is a strategic bottleneck through which conflict, shipping, insurance, inventories, spare capacity, and political signaling interact at once. With the Strait effectively closed or functionally blocked, the forecasting problem is no longer simply one of price prediction. It is one of regime change, logistics stress, and conditional decision support.
The right starting point, therefore, is not a single predictive equation but a scenario-based forecasting system. That system has to distinguish baseline oil-market behavior from shock behavior. In calmer periods, oil can be modeled through demand growth, supply growth, inventory tightness, spare capacity, product cracks, futures-curve shape, and macro variables such as industrial activity and the dollar. In a war-exposed chokepoint environment, however, prices are no longer being driven by those variables alone. They are also being driven by outage assumptions, war-risk insurance, convoy risk, tanker delays, freight spikes, rerouting bottlenecks, reserve releases, and the probability that transit resumes, stabilizes, or worsens. A model that does not separate those two worlds—baseline and shock—will tend to confuse structural tightness with geopolitical premium and will almost always produce a false sense of precision. That does not mean point forecasts become useless. They still retain value in three narrower functions: as a calm-market baseline for what oil might roughly be worth absent chokepoint stress, as a short-horizon operational reference for procurement and budgeting when conditions are not changing dramatically day by day, and as a benchmark against which a scenario system can be judged. The problem in Hormuz is therefore not the existence of point forecasts as such. It is the mistake of treating them as sufficient when the market is being driven by disruption states rather than normal price formation alone.
This is precisely why serious institutional forecasting already avoids the single-model trap. There is no universally accepted oil-price model because oil forecasting is not one problem; it is a family of problems that varies by horizon, data quality, institutional purpose, and the presence or absence of shocks. The main model families are well known: futures-curve models, which infer information from the slope and shape of the curve; time-series models such as AR, ARIMA, VAR, and BVAR, which search for statistical regularities in historical data; structural oil-market models that connect prices to inventories, production, and global activity; large macroeconometric models that embed oil in wider systems of growth, inflation, and policy; and machine-learning or hybrid models that attempt to detect more nonlinear patterns. The existence of these families is itself evidence that the task is plural, not singular.
A useful real-world example is the U.S. Energy Information Administration’s STEO Brent workflow. EIA does not rely on one model and call it definitive. It uses a pooled set of Brent forecasting models, supplements that with a linear regression model, and then applies analyst judgment rather than treating the output as a purely mechanical forecast. That structure is highly instructive. It shows that one of the world’s most visible public energy forecasters already treats oil forecasting as a portfolio problem rather than a search for one winning equation. In a Hormuz crisis, that lesson becomes unavoidable: robustness comes from model diversity, not model purity.
Other research points in the same direction. The structural tradition associated with Kilian and Baumeister argues that oil prices cannot be understood only through market-expectation proxies such as futures. They must also be tied to the real balance of the market through inventories, production, and indicators of global activity. That is crucial in the Hormuz setting. A futures-only model may tell you what the market is pricing at a given moment, but it does not necessarily tell you whether that pricing is robust under a 5 mb/d disruption, a 10 mb/d disruption, or an effective closure with gradual reopening. Structural models are useful precisely because they allow physical assumptions to be translated into plausible price implications. Even so, structural sophistication does not remove the need for humility. In a war setting, a model that promises too much precision is often telling you more about its own overconfidence than about the market. Humility is not optional when the system being modeled is being reshaped by conflict, logistics, and policy at the same time.
The right response for Hormuz, then, is not to abandon modeling but to redefine what modeling is for. In this context, a good model is not one that claims to foresee the exact day of a missile strike or the exact hour an insurer withdraws cover. It is one that asks a better class of question: if disruption equals X, duration equals Y, rerouting equals Z, and reserves respond in a given way, what range of prices becomes plausible? That is a meaningful forecasting problem. More importantly, it is a meaningful policy and decision problem. Governments, traders, importers, refiners, and infrastructure planners do not need a mystical “true price.” They need structured conditional estimates that help them prepare for multiple states of the world.
Once viewed in that way, Hormuz becomes the clearest case for a hybrid scenario model rather than a classic prediction model. The baseline still matters. Inventories still matter. The futures curve still matters. But the shock overlay matters just as much. And because that shock process is exogenous, political, military, and path-dependent, the model must be built to accept uncertainty rather than disguise it. Its output should therefore not be a solitary forecast number. It should be a fan of outcomes: de-escalation, mild disruption, severe disruption, closure with reopening, prolonged conflict, and overshoot scenarios in which the market prices panic beyond the balance-sheet fundamentals.
The deeper lesson is that Hormuz does not break modeling because the market is unknowable. It breaks simplistic modeling because the problem is not one-dimensional. Oil in a chokepoint war is simultaneously a commodity, a logistics system, a risk premium, a balance-sheet shock, and a political signal. The only serious analytical response is to build a framework that can hold all of those dimensions at once.
The real breakthrough is realizing that the “forecast” for Hormuz is not a number to be guessed, but a structured map of conditional outcomes showing how physical disruption becomes market price through multiple interacting channels.
Best-practice implications for the OHK framework are therefore straightforward: (i) separate baseline market behavior from geopolitical shock behavior, (ii) combine multiple model families rather than relying on a single winner, (iii) translate physical outage assumptions into price ranges rather than point illusions, (iv) keep the framework explainable enough for policy and investor use, and (v) treat the output as a live scenario dashboard rather than a static prediction.
Before outlining the OHK framework itself, it is useful to review the main model families already used in oil forecasting. The purpose is not to provide a literature survey for its own sake, but to clarify what each family contributes, where each falls short in a Hormuz crisis, and why the OHK architecture combines several of them rather than relying on any one alone.
The Current Modeling Landscape and Its Institutional Users: What Existing Oil Models Actually Do, Who Uses Them, and Why None Is Enough Alone

If Hormuz requires a scenario system, the next question is obvious: what models already exist, who uses them, and how close do they come to what is needed? The answer is that the world of oil-price modeling is already rich, differentiated, and institutionally embedded, but also fragmented. There is no single dominant model architecture because different institutions require different outputs. Governments need interpretable forecasts and policy counterfactuals. Central banks need inflation transmission and macro implications. Traders need front-end sensitivity and rapid updates. Research institutions need explanatory coherence. Hedge funds may want edge more than transparency. In that sense, the modeling landscape is not a search for one truth. It is a map of institutional purposes.
The first major family is the futures-based approach. These models use the crude futures curve, or futures-spot spreads, as a forecasting guide. They are attractive because they are simple, market-implied, and continuously updated. If the front of the curve is strongly backwardated or contangoed, that clearly contains information about scarcity, expectations, and storage economics. Public forecasters such as the EIA explicitly include futures-linked information in their oil-price workflows. But the limitation matters just as much as the attraction: futures are not forecasts in any pure sense. They are market prices shaped by hedging demand, convenience yield, liquidity, risk appetite, and time-varying premia. Federal Reserve research found only modest gains from futures at some horizons and no significant gains at shorter horizons, which is a useful reminder that futures can be informative without being decisive. In Hormuz terms, futures-based models are best at showing what the market is currently pricing into the curve, but weaker at distinguishing whether that price reflects durable physical shortage, temporary logistics stress, or a premium created mainly by fear and insurance disruption.
The second family is the time-series approach, including AR, ARIMA, VAR, and BVAR models. These methods search for statistical regularities in historical data and project them forward. They are often useful for benchmarking, short-horizon extrapolation, and testing whether a more complicated model actually adds value. VAR and BVAR variants are especially common in policy institutions because they allow oil, inventories, industrial activity, inflation, and exchange rates to move together within a transparent statistical structure. The attraction here is discipline: one can generate a baseline and compare it against alternatives. But Hormuz exposes their core weakness. Time-series models learn from historical relationships; they are less comfortable when war changes the regime. A prolonged closure threat, a spike in war-risk premiums, or a convoy system that slows energy transport are not ordinary seasonal variations. Pure time-series models can therefore look statistically elegant while remaining strategically underpowered. These models are best used as disciplined baselines and benchmarking devices, especially over short horizons, but they are weak when the market shifts into a geopolitical regime that has little clean precedent in the training data.
The third and perhaps most analytically important family is the structural oil-market model. This is where the work associated with Kilian, Baumeister, and related researchers becomes especially relevant. Rather than simply extrapolating price history or reading the curve, these models connect oil prices to the physical and economic structure of the market: supply, demand, inventories, spare capacity, and global real activity. Their appeal is not merely predictive. It is interpretive. They help answer why prices move, not only whether they might move. In a Hormuz context, this matters enormously because structural models allow analysts to ask conditional questions: What happens if net supply loss is 2.5 mb/d after rerouting and stock releases? What if it is 6 mb/d? What if inventories are already tight? What if spare capacity is lower than assumed? That is exactly why research and policy institutions continue to rely on structural approaches when crisis analysis matters. This family is best at translating physical oil-market stress into price implications and at supporting counterfactual questions, but it can still struggle when the main driver is not only lost barrels, but the interaction of military risk, shipping confidence, and policy timing.
The fourth family is the large macroeconometric model. These are often maintained by institutions such as the World Bank, central banks, and commercial forecasting groups. In these systems, oil is not modeled in isolation. It is embedded in a wider framework that includes GDP, inflation, trade, policy rates, exchange rates, and regional linkages. This is useful because the consequences of a Hormuz shock do not stop at crude prices. They spill into inflation, household budgets, industrial costs, external balances, and policy response. The World Bank’s commodity forecasting work explicitly points toward a model suite rather than a single preferred specification, combining approaches such as futures, consensus forecasts, BVARs, larger macro frameworks, and other complementary techniques. That recommendation reflects institutional maturity: the objective is not to discover one perfect model, but to combine perspectives that are differently wrong in useful ways. These models are best at tracing second-round effects—especially inflation, growth, and policy transmission—but they are usually too slow and aggregated to capture the front-end violence of a live Hormuz logistics shock.
The fifth family is the machine-learning and hybrid approach. These models attempt to capture nonlinearities, interactions, and higher-dimensional patterns that traditional econometrics may miss. They may include ensemble methods, volatility layers, decomposition techniques, sentiment inputs, or high-frequency signals. In private markets, machine learning is often paired with text, flow, or real-time indicators. Yet the challenge here is not sophistication; it is governance and relevance. In calm periods, ML can appear powerful. In geopolitical regime breaks, however, the danger is that the model has learned the wrong world. A machine-learning system that has never truly encountered a comparable Hormuz regime can generate numbers with remarkable confidence and weak strategic value. That does not make ML useless. It means that, in this setting, it is usually better used as a supporting layer rather than the sovereign brain of the system. In this context, machine-learning methods are best at pattern extraction and nonlinear signal support, but they are weakest when asked to interpret an event for which the real problem is strategic novelty rather than hidden statistical regularity.
Who uses these models depends heavily on institutional need. Governments and public agencies tend to favor pooled systems, structural frameworks, and econometric models because they need explanations that can support policy choices and public communication. Central banks use structural and macroeconometric frameworks because they care about inflation, growth, and transmission. International institutions rely on model suites because no single method is robust enough across all horizons and commodities. Traders and private funds often layer in proprietary high-frequency signals, text analytics, or flow indicators because they need edge and speed. But the broad convergence across serious institutions is unmistakable: they do not rely on a single model family for complex oil questions. EIA’s Brent workflow, for example, explicitly pools five real-time forecasting models, while the World Bank’s forecasting research likewise advocates a suite of approaches rather than one winner.
This matters because Hormuz is not merely an oil-price forecasting challenge. It is a cross-domain stress problem. The best existing models each capture a different slice of that reality. Futures capture market pricing. Time-series models provide disciplined baselines. Structural models translate physical balances. Macro models connect oil to wider economic consequences. Machine learning can sometimes detect nonlinear stress. But none of these alone is enough. The oil problem in Hormuz is at once physical, financial, logistical, and geopolitical. The world of existing models should therefore not be read as a menu from which one perfect option is selected. It should be read as a toolkit from which a hybrid system is assembled.
The important discovery is not that the world lacks oil-price models. It is that every serious institutional user already behaves as if no single model is sufficient when the market is being shaped by war, logistics, and policy at the same time.
For the OHK framework, the practical lessons are clear: (i) preserve institutional interpretability rather than hiding logic inside a black box, (ii) combine market, structural, and scenario layers in one architecture, (iii) use each model family for the horizon and function it suits best, (iv) benchmark all outputs against simple baselines and live market prices, and (v) turn the final system into an applied decision tool for governments, investors, and strategic planners.
Data Provenance and Model Governance: What Is Live, What Is Proxied, How the Model Is Updated, and Who Owns Judgment
The credibility of a live-anchored crisis model depends not only on its equations, but on its governance. In a Hormuz setting, some inputs can be observed directly, others must be proxied, and scenario weights inevitably involve judgment. This section clarifies what in the OHK framework is live, what remains estimated, how often the model should be updated, what should trigger a rerun, and how to distinguish a change in assumptions from a change in model architecture. The point is simple: a serious model requires not just methodology, but operational discipline.
A model like OHK’s should not be judged only by what it calculates. It should also be judged by how clearly it distinguishes between live data, transparent proxies, and scenario judgment. In a chokepoint crisis, that distinction is not a technical footnote. It is part of the analytical integrity of the system.
The first category is live public anchors. These are inputs that can be tied directly to current public reporting or observed market conditions. In the March 12, 2026 live-anchored run, this included Brent settlement, war-risk insurance conditions, the number of delayed or stranded ships reported in public coverage, and the broad stress level in tanker and LNG shipping. These are the variables that give the model its connection to the real market and prevent it from drifting into purely hypothetical territory.
The second category is transparent proxies. These are inputs that are not available as clean public live prints in the same format or frequency as the model requires, but which still need to be represented for the system to function coherently. In the current workbook architecture, that includes parts of the futures curve, some product-crack assumptions, some volatility and freight translations, and some elements of LNG stress mapping. The crucial point is that these are not hidden guesses. They are visible assumptions, documented in the workbook, and intended to be revised as stronger inputs become available. Their legitimacy depends not on pretending they are perfect, but on making them explicit enough to be challenged and improved.
The third category is scenario judgment. This includes the probabilities assigned to different states of the world, the interpretation of what counts as mild versus severe disruption, and the implied pace of stabilization or reopening. These are not purely statistical outputs. They are structured analytical judgments made in light of current market conditions, reported disruptions, logistical stress, and institutional experience. A serious model should never disguise these judgments as though they were discovered objectively by the spreadsheet itself.
That leads directly to governance. A live-anchored Hormuz model should be updated on at least two frequencies. The market layer should ideally be refreshed daily or whenever significant market moves occur. The structural balance layer can update more slowly, since inventories, supply, demand, and macro conditions usually move on weekly or monthly rhythms. The scenario layer should update whenever there is a material change in commercial transit, insurer behavior, reserve deployment, military posture, or credible diplomatic movement. In other words, not every new price print justifies a full scenario reset, but every material change in the state of the crisis potentially does.
It is also important to distinguish between a model rerun and a model change. A rerun means the same architecture is being updated with new inputs or revised scenario weights. A model change means the structure itself has been altered — for example, new variables have been added, the weighting system has changed, a new scenario has been introduced, or the decomposition logic has been revised. That distinction matters because users need to know whether the difference in output comes from the world changing or from the model changing.
In institutional use, this would imply a simple governance rule. Market inputs should be owned by the data process. Proxy assumptions should be owned by explicit methodological notes. Scenario probabilities should be revised through structured analyst judgment. Model architecture changes should be versioned and documented separately from ordinary reruns. That is what turns a workbook from an interesting analytical tool into something closer to an institutional forecasting framework.
The broader point is that governance is not separate from model quality. It is part of model quality. A system that cannot explain which numbers are observed, which are inferred, which are judged, and when each is updated will always be harder to trust, even if its outputs appear plausible. The OHK framework is strongest when it is understood not just as a spreadsheet model, but as a governed analytical process with visible boundaries between data, proxy, and judgment.
Best Practices for Hormuz Forecasting: What Good Oil Models Should Do, What They Should Avoid, and Where Their Limits Begin
Once the model landscape is understood, the real question becomes one of discipline: what should a serious Hormuz oil model actually do well, and what mistakes must it avoid? The answer starts with a simple rule that is often violated: do not bet on one model. This is not merely an abstract methodological preference. It is a lesson grounded in institutional practice and in the literature itself. The World Bank’s model-suite approach argues against searching for one best commodity model. The Bank of Canada has likewise emphasized the value of combining forecasts from alternative models with different strengths and weaknesses. EIA’s Brent workflow does the same by pooling multiple models rather than elevating a single one. The common thread is unmistakable: robustness comes from combination, not from monogamy. There is also a data-governance discipline that becomes essential once a model is used in live crisis conditions rather than only in research. A mature Hormuz framework should keep every major input timestamped, tagged to a named source, labeled clearly when it is a proxy rather than a direct observation, and version-controlled when scenario assumptions change. This is not just a technical nicety. It is what allows institutional users to distinguish between what the market actually observed, what the model derived, and what the analyst judged. Without that discipline, a live-anchored model can become harder to audit precisely when credibility matters most.
The second best practice is to match the model to the forecast horizon. This matters because short-horizon oil dynamics are not the same as medium- or long-horizon dynamics. Over the next few days or weeks, market-based variables such as the front of the futures curve, implied volatility, product cracks, freight indicators, and war-risk pricing can be highly informative. At intermediate horizons, many sophisticated models struggle to beat a simple no-change benchmark consistently, which means caution is essential. At longer horizons, the structural drivers of the oil market—global demand growth, supply response, spare capacity, inventories, and policy changes—become more meaningful than any claim to next-day precision. In plain terms, a model that is useful for next week is not automatically useful for next year. A serious Hormuz framework must therefore be modular by horizon, rather than pretending that one architecture can dominate across every timescale.

The third best practice is to benchmark constantly. Every advanced oil model should be tested against simple alternatives: a no-change forecast, the front of the futures curve, and a basic structural baseline. This may sound modest, but it is one of the strongest disciplines in forecasting. If a sophisticated model cannot beat those basic references—or at least cannot add qualitative value beyond them—it is not really advancing understanding. In a geopolitical setting, benchmarking also forces humility. If the market is pricing Brent in one range and a model insists on a radically different level without a convincing account of the war premium, the model is not necessarily brave; it may simply be broken. Likewise, if it produces extreme upside numbers without a defensible net-loss chain, the problem is not insight but exaggeration. Benchmarking is what keeps sophistication honest.
The fourth best practice is to separate baseline dynamics from shock overlays. This is arguably the most important design principle for Hormuz. Baseline oil prices emerge from recognizable drivers: inventories, supply-demand balances, futures structure, spare capacity, macro demand, and related indicators. Hormuz-type events, by contrast, are exogenous shock processes. They involve physical outages, insurance withdrawal, shipping delays, military escalation, convoy requirements, rerouting limits, and the psychology of uncertainty. A model that tries to absorb all of that into one undifferentiated forecasting equation risks confusion. It may incorrectly attribute a war premium to fundamentals, or fundamentals to war. The more serious approach is to decompose the system explicitly: here is the baseline level absent crisis; here is the premium from net disruption; here is the risk layer from freight, insurance, and escalation; and here is the offset from reserves, alternate supply, or reopening. That decomposition is far more useful for decision-making than a mysterious one-line coefficient system.
The fifth best practice is to produce distributions, not declarations. For Hormuz, the right output is rarely a point estimate. It is a range of conditional outcomes. That means fan charts, scenario paths, severe-upside cases, de-escalation paths, and probability-weighted expectations. If the model produces one Brent number with no sense of range, then it is likely too fragile for the problem at hand. The right question is not What is the one true oil price? but rather What prices become plausible under mild disruption, severe disruption, effective closure, or reopening? This is also why scenario naming matters. A useful system should define explicit states such as base, mild disruption, severe disruption, closure with gradual reopening, prolonged regional conflict, and de-escalation. Those labels discipline interpretation and keep the model tied to actual decision environments.
The sixth best practice is to be explicit about what the model cannot do. This is not a weakness. It is part of credibility. A Hormuz oil model can estimate what Brent might do if 5 mb/d is shut in for eight weeks and war-risk insurance spikes. It can show how much reserve releases might offset that. It can show how bypass capacity changes net supply loss. It can estimate how much of current spot price reflects baseline structural conditions versus geopolitical premium. But it cannot reliably predict the exact day of a missile strike, whether covert diplomacy succeeds, whether insurers reverse course overnight, or whether a particular military exchange produces escalation or stabilization. Those are not failures of modeling skill. They are the unavoidable limits of trying to model a world in which political and military choices are endogenous, strategic, and path-dependent.
This distinction is exactly what makes some model types stronger than others in the Hormuz setting. What these models are good for is quantifying the baseline, stress-testing outage assumptions, translating supply loss into plausible price paths, identifying how much reserves and rerouting can cushion the blow, and clarifying whether the market is pricing something closer to mild disruption or full closure. What they are bad for is forecasting triggers, timing, and the escalation path of war itself. That is why a single ARIMA, a single LSTM, or the raw futures curve by itself is not suitable. Each captures something, but none captures the full strategic system. The only genuinely suitable setup is a hybrid architecture: a pooled baseline forecast, a structural balance model, a Hormuz-specific scenario engine, and, where possible, a real-time stress layer that incorporates futures spreads, options-implied volatility, tanker rates, and war-risk insurance.
The intellectual payoff of all of this is clarity. A good Hormuz model is not a prediction machine in the popular sense. It is a decision-support architecture. It helps policymakers and market participants distinguish between what is structural, what is shock-driven, what is reversible, what is path-dependent, and what range of outcomes remains plausible under competing assumptions. That is the standard to aim for.
The true test of a Hormuz oil model is not whether it pretends to know the future, but whether it can cleanly separate normal market structure from crisis distortion and then map the range of credible outcomes under stress.
These lessons translate into five working principles for the OHK framework: (i) treat scenario design as central rather than secondary, (ii) benchmark every output against simple and transparent comparators, (iii) distinguish what the model can estimate from what it cannot predict, (iv) build outputs around distributions and ranges rather than point-forecast theater, and (v) ensure that every major premium in the model can be traced back to a physical, logistical, financial, or policy assumption.
The OHK Hormuz Oil Stress Model: Architecture, Spreadsheet Logic, Live Anchoring, and What Our Estimates Say Relative to the Market

The OHK model is built to answer a simple question: when oil prices move during a Hormuz crisis, how much of that move comes from normal market fundamentals, and how much comes from disruption, fear, and policy response?
To answer that question, the model does not produce a single number. Instead, it works in three layers.
Layer A is the normal oil market. It captures the usual drivers of oil prices, including supply, demand, inventories, spare capacity, the futures curve, product cracks, and broader macro conditions.
Layer B is the Hormuz disruption layer. It adds the crisis-specific factors: disrupted barrels, outage duration, rerouting capacity, war-risk insurance, tanker freight stress, and the extent to which supply can be replaced or released from reserves.
Layer C is the scenario layer. This converts the inputs into a set of possible states rather than one headline forecast. These states include base conflict, mild disruption, severe disruption, closure with reopening, prolonged conflict, and de-escalation.
That structure matters because Hormuz is not a normal forecasting problem. The market is not reacting to one variable. It is reacting to a combination of physical supply risk, shipping disruption, insurance stress, fear, and policy response.
The model also breaks the oil price into four parts:
Price = Baseline + Shock Premium + Risk Premium + Policy Offset
In plain English:
Baseline is what oil would roughly be worth from normal market fundamentals
Shock Premium is the extra price caused by actual lost or delayed barrels
Risk Premium is the extra price caused by fear, insurance stress, freight stress, and escalation risk
Policy Offset is whatever pushes the price back down, such as reserve releases, alternate supply, diplomacy, or reopening
This is useful because it helps answer a basic question: is oil expensive because the market is fundamentally tight, because disruption is real, because fear is high, or because the response has not yet calmed the system? Read schematically, the March 12 OHK decomposition looks like this: observed Brent sat at $100.46/bbl; the model-implied structural baseline was $75.7/bbl; the difference was distributed across shock premium, risk premium, and a smaller policy offset; and the final probability-weighted estimate came to $101.6/bbl. That quick comparison is important because it shows that the model is not trying to replace the market price. It is trying to explain how much of that market price appears structural and how much appears linked to Hormuz-related disruption and risk.
Inside the model, the normal market layer uses a blend of approaches, not one formula. One part looks at the market directly through Brent futures, time spreads, product cracks, the dollar, and an industrial commodity index. Another looks at physical balances such as inventories, supply, demand, spare capacity, and global activity. A third acts as a simpler benchmark based on past Brent behavior and volatility. These are then combined rather than forced into one “winner,” which is broadly consistent with how major forecasters such as the EIA handle Brent forecasting through pooled models, supplementary regression analysis, and analyst judgment.
The Hormuz-specific layer then adds the crisis variables. The most important of these is net supply loss. The model does not stop at the headline number of how many barrels are “at risk.” It asks how much oil is actually lost to the market after offsets are counted. So if 8 million barrels per day are disrupted, but some are rerouted, some are replaced, and some are covered by reserves, the model works with what is left after those adjustments. That is the number that matters most for price.
It is also important to distinguish between the different types of model runs used in the framework. In practice, the OHK framework should be read through three distinct uses. A live-anchor run explains what the market appears to be pricing on a known date. A forecast run projects forward under current assumptions. A stress-test run shows how much higher or lower Brent could move if the shock deepens or unwinds. Keeping those functions separate helps prevent one of the most common mistakes in crisis analysis: confusing interpretation of the current market with prediction of the next event.
In the March 12, 2026 live-anchored run, the model used the real market conditions of that day. Brent was set at $100.46 per barrel, which was the actual Brent settlement that day. Reuters reported Brent settling at $100.46, after touching an intraday high of $101.60. The model also used crisis inputs for that same date, including a 3% war-risk premium and 150 delayed or stranded ships—both used as OHK model assumptions or transparent proxies—as well as higher freight and LNG stress to reflect the sharp increase in tanker and LNG shipping costs reported at the time. Reuters reported all-time-high Middle East oil shipping costs in early March and LNG freight rates jumping more than 40%.
From those inputs, the model produced several scenario prices. These are not all market prices that happened on that day. They are the prices the model associates with different possible crisis states.
Here is how to read them:
$100.46/bbl = the real Brent market price on March 12
$75.7/bbl = the model’s underlying structural baseline
$92.9/bbl = the model’s base conflict case
$100.1/bbl = the model’s mild disruption case
$115.7/bbl = the model’s severe disruption case
$134–135/bbl = the model’s closure / prolonged conflict case
high $70s = the model’s de-escalation case
$101.6/bbl = the model’s probability-weighted estimate
The most important distinction is that $75.7/bbl is not a historical pre-crisis market price. It is an internal structural baseline produced by the model on March 12: an estimate of what Brent might have been worth absent the additional premium created by Hormuz-related disruption, logistics stress, insurance shock, and escalation risk. More specifically, it is the model’s estimate of oil’s underlying structural value on March 12 before adding the extra Hormuz-related crisis premium. If one wanted the actual pre-disruption market price, that would have to be a real Brent price from a date before the closure entered the market. That is a different concept entirely.
So the right way to read $75.7/bbl is this: the model is saying that, within the March 12 price of $100.46, about $75.7 reflected underlying oil fundamentals, while the remainder reflected Hormuz disruption, freight stress, war-risk insurance, escalation risk, and related crisis pricing. That is why it is better described as the underlying structural baseline, not the pre-closure oil price.
How to Read the OHK Scenario Ladder—What the States Mean, How They Differ, and Why They Should Not Be Confused? The scenario ladder then becomes easier to understand. The base conflict case represents a world in which regional conflict is clearly affecting oil markets, but disruption has not yet escalated into a severe or closure-level state. The mild disruption case is one step more serious: conflict is no longer just adding fear, but is also causing real, limited disruption to flows, shipping, or logistics. The severe disruption case represents a much larger and more material disruption to oil and gas flows, shipping, insurance, and logistics, causing a substantial effective supply loss without yet assuming a full or prolonged closure. The closure / prolonged conflict case reflects a world in which the Strait itself becomes the dominant constraint and the market begins pricing a sustained chokepoint crisis. The de-escalation case reflects the opposite direction: conflict risk begins to ease, shipping confidence starts to recover, and part of the Hormuz-related premium starts to unwind.
The probability-weighted estimate is the model’s final blended oil price after assigning a likelihood to each scenario and averaging the results. Instead of choosing a single outcome, the model asks how likely mild disruption, severe disruption, closure, or de-escalation each are, then combines them into one summary number. It therefore represents the model’s best overall reading of what the market appears to be pricing across multiple possible states of the world.
That means the model was effectively saying that on March 12, the market looked closer to a mild disruption scenario than to a full sustained closure scenario. The logic is simple: if the market had truly been pricing the worst-case closure state as dominant, the model suggests oil would have been much higher—closer to $134–135/bbl than to $100/bbl. A later market move should therefore be read as follow-on validation rather than part of the original live-anchor frame. The OHK March 12 run was designed to interpret market pricing on that date. Subsequent price action, including the higher levels seen by early April, is useful as a test of whether the model’s higher-stress scenarios were directionally available in advance, but it should not be conflated with the date on which the model was originally anchored.
That is the first way the model can be judged: did its blended reading make sense relative to the actual market price that day? On that test, it performed reasonably well.
But the model can be judged a second way as well. Because it already contained a closure scenario, it is possible to ask whether later market behavior moved in the direction of that higher-stress path as the crisis worsened. And it did move higher. As a subsequent validation point rather than part of the original March 12 anchor, Reuters reported that by April 2, 2026, Brent had risen to about $109.03, with the Strait still effectively shut down.That later move does not invalidate the March 12 run; it shows that the market subsequently shifted further toward the model’s higher-stress scenarios.
That does not mean the March 12 weighted estimate was wrong. It means that on March 12 the market still looked closer to mild disruption, but later conditions pushed pricing further into higher-stress territory. In that sense, the model was useful in two ways: it explained the market reasonably well on March 12, and it already had higher-stress scenarios ready for a worsening crisis.
Compared with outside forecasts, the OHK framework is best understood as a stress-testing and interpretation system rather than a simple directional call. Its value is not that it replaces spot, EIA, or bank forecasts, but that it decomposes what those numbers may actually mean under different disruption states. The EIA’s latest outlook still keeps Brent above $95 over the next two months before dropping below $80 in the third quarter and toward $70 later in the year, which makes it a useful reference for a central normalization path. For the current crisis state, however, a more relevant outside comparison is the much higher near-term stress range cited by Reuters from JPMorgan, which saw Brent at $120–$130 in a severe disruption case and above $150 if the crisis persisted deeper into May. By contrast, Goldman Sachs’ $71 Q4 forecast is better read as a later-year normalization view rather than a current Hormuz closure price. The OHK model is more explicit than those headline forecasts about the difference between mild disruption, severe disruption, and closure-type states.
So the real value of the OHK model is not that it claims to know one “correct” oil price. Its value is that it helps explain what kind of crisis state the market appears to be pricing, how much of that price reflects normal fundamentals versus crisis premium, and what price ranges become plausible if conditions worsen or improve.
The key insight from the OHK model is that once oil prices are decomposed into structural baseline, disruption premium, risk premium, and policy offset, market pricing becomes far easier to interpret as a reflection of scenario probability rather than market mystery.
For the OHK model, the resulting methodological priorities are clear: (i) structure the forecast around a baseline-plus-shock architecture, (ii) convert physical chokepoint stress into transparent price premia, (iii) maintain a scenario engine that reflects real operational states rather than abstract labels, (iv) anchor the model to live public information while documenting every proxy clearly, and (v) compare OHK outputs against spot prices, scenario evolution, official forecasts, and bank expectations to ensure analytical discipline.
What the OHK Model Can Estimate, What It Cannot Predict, and Why That Distinction Matters

One of the most important disciplines in building a Hormuz oil model is knowing where the model’s usefulness ends. In a chokepoint war, the line between what can be estimated and what can be predicted is not academic. It is central. A model can estimate the price implications of a given net supply loss, the effect of higher war-risk insurance, the stress created by tanker delays, the cushioning role of reserve releases, and the premium associated with disruptions of different scale and duration. What it cannot do with robust confidence is predict the exact political or military trigger that causes one scenario to become real.
That distinction matters because many forecasting failures begin not with bad mathematics, but with category confusion. A model may be very good at translating physical disruption into plausible price ranges and still be poor at anticipating whether a missile strike happens tomorrow, whether diplomacy succeeds over the weekend, whether insurers restore cover, or whether a convoy regime revives commercial confidence. Those are not standard market variables. They are strategic decisions made by states, militaries, insurers, and intermediaries. They are reflexive, path-dependent, and often sudden. In other words, they are events to which the model must respond, not events the model can reliably foresee from within itself.
This is why the OHK framework should be judged less like a crystal ball and more like a stress-translation system. Its strength lies in answering conditional questions clearly. If net supply loss is 2 mb/d after mitigation, how different is the price path from a case in which net loss is 6 mb/d? If war-risk premiums rise from 0.25% to 3%, how much of current spot price reflects logistics stress rather than underlying structural tightness? If reserve releases arrive faster than expected, does the market move from a severe disruption range back toward a mild disruption range? These are the questions that matter for policymakers, importers, investors, and strategic planners. They do not need the model to predict war in some mystical sense. They need it to clarify consequences.
This is also the right way to think about uncertainty. In a Hormuz crisis, uncertainty is not a flaw in the model. It is part of the system being modeled. Physical flows, military signaling, shipping confidence, insurer behavior, and market psychology are all interacting in real time. A serious model should therefore make uncertainty visible, not hide it behind false precision. It should separate what is structural from what is shock-driven, what is policy-sensitive from what is path-dependent, and what can be estimated from what must remain unknown until events unfold. That does not weaken the model. It makes it more credible.
The practical implication is straightforward. The OHK model should be read as a tool for conditional interpretation, not deterministic prophecy. To take a simple worked example: suppose gross disruption is 8 mb/d, available bypass capacity offsets 3 mb/d, reserve releases contribute 1 mb/d, and alternate supply adds another 0.5 mb/d. The resulting net supply loss is not 8, but 3.5 mb/d. That distinction matters enormously. In the OHK logic, a market facing a 3.5 mb/d effective loss would be more consistent with a severe-but-manageable disruption range than with a total closure regime. A market facing the full gross 8 mb/d without mitigation would sit in a very different price band. The model’s purpose is precisely to force that adjustment chain into view before price conclusions are drawn. It is strongest when it estimates how markets may behave under specified assumptions, how much of a move reflects crisis stress rather than embedded fundamentals, and how resilient or fragile the system becomes once reserves, bypass routes, and alternate supply are introduced. It is weakest when asked to forecast the timing of escalation itself. That is not a defect unique to OHK. It is the basic condition of serious modeling in a war setting.
The model becomes most credible when it translates war stress into disciplined price ranges and makes clear which assumptions are doing the analytical work.
For OHK, the broader lesson resolves into five practical rules: (i) separate estimation from prediction, (ii) use the model to translate scenarios rather than forecast military triggers, (iii) reveal uncertainty instead of hiding it inside false precision, (iv) make conditional outcomes explicit enough for policy and investment use, and (v) preserve the distinction between structural market signals and exogenous geopolitical events.
From Forecast to Decision Tool: How a Hormuz Model Should Actually Be Used by Governments, Investors, and Strategic Planners

A Hormuz oil model becomes truly valuable only when it moves beyond abstract forecasting and becomes a decision tool. That matters because the users who matter most in a chokepoint crisis do not all need the same thing. Governments need to know how much reserve cover they may need under different disruption durations, how quickly inflation risk may spread, and when emergency measures should be triggered. Refiners and importers need to understand how much of their exposure lies in freight, insurance, and delayed cargoes rather than in outright physical shortage. Investors need to judge whether the market is pricing mild disruption, severe disruption, or an overshoot driven by fear. Strategic planners need to know which assumptions actually change the outcome. A model becomes useful when it helps each of these users make decisions under stress.
That is why output design matters as much as model design. A serious Hormuz system should not present itself as a single forecast cell in a spreadsheet. It should present a dashboard of conditional states: baseline price, current geopolitical premium, severe-case path, de-escalation path, estimated net supply loss, reserve offset assumptions, and, where relevant, inflation or freight implications. Once structured this way, the model stops being a technical exercise and becomes a planning instrument. A ministry can use it to test policy options. An importer can use it to assess exposure. An investor can compare market pricing with internally assessed scenario probabilities. The model is no longer just “about Brent.” It is about how to operate when Brent is being shaped by chokepoint stress.
For governments, the greatest value of the framework is in reserve planning and shock preparedness. A scenario engine can help answer practical questions such as how many weeks of severe disruption can be absorbed before inventories become critical, how much strategic stock release would be needed to offset delayed imports, or whether a mild disruption already justifies emergency procurement or diplomatic action. For import-dependent economies, this is far more useful than a point forecast. A single price number does not tell a policymaker when to act. A scenario ladder does. It links assumptions to thresholds and shows which state of the world the country is in and which one it may be moving toward. For a government, then, the model is best understood as a reserve-and-response tool. It helps answer when to release stocks, when to escalate diplomatic engagement, when to subsidize emergency imports, and when a logistics problem is becoming an inflation problem. Its value is not that it predicts the next strike, but that it helps define which threshold has been crossed and what policy response becomes rational once it is.
For investors and commodity participants, the value is different. Here the model is less about policy triggers and more about price decomposition. The central question becomes: how much of current spot reflects structural balances, how much reflects effective supply loss, and how much reflects market fear? That distinction matters because crisis markets often compress several stories into one number. A decomposition framework can show whether spot is still consistent with a mild-disruption equilibrium, whether it is drifting toward a severe case, or whether it has overshot its own fundamentals because freight, insurance, and sentiment are temporarily dominating. The model does not replace the market. It helps interpret what the market is doing. For refiners and import-dependent buyers, the same framework serves a different purpose. It helps separate feedstock risk from logistics risk, estimate how much of a procurement problem lies in freight and insurance rather than outright scarcity, and compare the value of earlier purchases, inventory drawdown, or alternate sourcing. In that setting, the model is less a price forecaster than a procurement-stress translator.
For investors and traders, by contrast, the practical use is comparative rather than operational. The key question is whether spot appears consistent with mild disruption, severe disruption, or market overshoot. A scenario system is useful here not because it gives a perfect target, but because it helps identify when the market may be underpricing escalation, overpricing panic, or compressing too many different risks into a single headline number.
For strategic and infrastructure planners, the value is broader still. The model becomes a way of testing resilience architecture itself. If alternate bypass capacity rises by 1 mb/d, how much does the severe-case premium fall? If reserve cover rises by 30 days, how much more stress can the system absorb before panic pricing begins? If freight disruption rather than physical outage is the main constraint, would short-term storage investment do more than pipeline expansion? Used this way, the framework becomes a bridge between market analysis and infrastructure planning. It begins to answer a deeper question: what would the system have needed to build differently for oil pricing to respond less violently in the first place?
This is ultimately the strongest argument for the OHK approach. A scenario model is not merely a forecasting engine. It is a framework for linking physical vulnerability, market reaction, and strategic choice in one operational system. In that sense, it is closer to an early-warning and planning architecture than to a speculative price toy.
The real value of a Hormuz oil model lies not in predicting the next price tick, but in helping institutions act earlier, think more clearly, and prepare more seriously across multiple possible states of the world.
For the OHK framework, the practical lessons are clear: (i) design outputs for decisions rather than only for forecasts, (ii) link market outcomes to policy and infrastructure assumptions, (iii) make the dashboard usable across governments, investors, and planners, (iv) structure scenarios around operationally meaningful states rather than abstract labels, and (v) ensure that every major output can support a real planning judgment under stress.
What the Model Reveals About the Market Now: Interpreting Spot Price as Scenario Probability Rather Than a Single View of Reality

One of the most useful features of a layered Hormuz model is that it changes how current oil prices should be read. In normal commentary, spot price is often treated as though it were a simple statement about supply and demand. In a chokepoint war, that becomes misleading. The market is not pricing only physical fundamentals. It is also pricing disruption size, disruption duration, war-risk insurance, tanker availability, reserve credibility, freight stress, and the probability of escalation versus reopening. In that sense, spot price is not just a commodity signal. It is a probability-weighted geopolitical signal.
This is exactly where the OHK framework becomes useful. By decomposing price into baseline structure, disruption premium, risk premium, and policy offset, the model allows the analyst to ask a more meaningful question than whether oil is simply “high” or “low.” That distinction is especially important for the model’s internal baseline. When the OHK framework identifies a structural baseline of $75.7/bbl for March 12, it is not claiming that $75.7 was the actual pre-closure market price of oil. It is saying that, within the March 12 observed price, that was the model-implied structural component before adding the extra premium associated with Hormuz disruption, logistics stress, insurance shock, and escalation risk. It asks what kind of world the market appears to be pricing. A given Brent price may imply that traders are not pricing a full and durable closure of the Strait, but neither are they assuming a rapid return to normal logistics. Instead, the market may be expressing something closer to a mild-to-serious disruption regime: one in which flows are impaired, insurance is stressed, shipping is more expensive, and deeper escalation remains possible, but a complete long-duration breakdown is not yet the dominant expectation.
That distinction matters because it separates market level from market meaning. A headline may report that Brent is at a certain level, but that level alone does not tell us whether the market sees the situation as temporary, severe but manageable, or the start of a much larger breakdown. A scenario model helps unpack that. If the OHK mild-disruption case clusters near observed spot while the closure case remains far above it, the model is effectively saying that the market is assigning more weight to constrained continuity than to outright systemic failure. That is a much richer interpretation than simply saying oil is “up because of war.”
It also changes how outside forecasts should be read. A public forecaster such as the EIA may publish a central path that assumes conflict persistence but gradual normalization, while a bank may publish a lower year-end number because it assumes the crisis premium will decay. Those are not necessarily contradictions. They may simply reflect different probability structures across time. In that sense, the OHK model is less a competitor to external forecasts than a translator between them. It can show that today’s spot price is consistent with one family of scenarios, while a lower medium-term forecast may reflect a different assumed balance between reopening, reserve use, and demand adjustment.
This is why spot price should not be read as a verdict. It should be read as a weighted average of fear, fundamentals, logistics, and policy expectations. The value of the model lies in making those weights more visible. Once that happens, the market stops looking like a mysterious number and starts looking like a system that is pricing multiple possible worlds at once.
The key insight is simple: in a Hormuz crisis, the current oil price is best understood not as one view of reality, but as a compressed distribution of competing realities whose probabilities are constantly shifting.
For the OHK model, the analytical takeaway is straightforward: (i) interpret spot prices as scenario-weighted outcomes rather than literal truths, (ii) separate physical market balance from embedded geopolitical premium, (iii) compare current price against multiple modeled states rather than a single benchmark, (iv) use external forecasts as alternative probability structures rather than rival numbers, and (v) treat the model as a tool for reading market meaning, not just market level.
What Would Falsify the Current OHK Read? Conditions That Would Force a Reinterpretation

The strength of a serious model lies partly in showing what would make it wrong. The March 12 OHK read interpreted the market as pricing something closer to mild disruption than full sustained closure. But that interpretation is conditional, not permanent. This section explains what kinds of later market, logistics, or policy developments would invalidate that read, what would move the market decisively toward severe-disruption or closure pricing, and what would make the model’s baseline-premium decomposition no longer analytically credible. A model becomes more mature when it states its own failure conditions clearly.
Any serious interpretation of the March 12 market needs to be paired with a falsification test. The OHK model read the market that day as being closer to a mild disruption state than to a full sustained closure state. That was a reasonable interpretation given the relationship between spot Brent and the model’s scenario ladder. But it should not be treated as a timeless conclusion. It was a conditional reading of one moment in the crisis.
What would make that reading wrong? The clearest falsifier would be a sustained market move into a price range that the model associates much more strongly with severe disruption or closure than with mild disruption. If Brent were to remain materially above the mild-disruption range and begin clustering persistently toward the model’s severe or closure states, then the March 12 interpretation would have to be revised. A one-day spike would not necessarily do that. A sustained shift in regime would.
A second falsifier would come from the logistics layer rather than the price itself. If commercial transit remained functionally impaired for longer than assumed, if tanker availability tightened further, if insurance markets withdrew more broadly, or if freight stress rose far beyond the March 12 anchor, then the logic of the mild-disruption interpretation would weaken even before the market price fully adjusted. In other words, the model could be falsified by the operating reality of the corridor, not just by the observed Brent number.
A third falsifier would involve the mitigation chain. The March 12 framework assumes that some combination of rerouting, reserves, alternate supply, and policy response helps prevent the crisis from immediately translating into a worst-case effective shortfall. If those offsets proved materially weaker than assumed — for example, if bypass routes underperformed, reserve releases were delayed, or alternate supply could not arrive meaningfully — then the model’s net-loss assumptions would need to be revised upward. And once net-loss assumptions move, the price interpretation should move with them.
A fourth falsifier would work in the opposite direction. If commercial confidence returned faster than expected, if traffic resumed more credibly, if insurers normalized faster, or if diplomatic de-escalation became materially more believable, then even the mild-disruption interpretation could become too severe. In that case the model would need to shift toward the de-escalation or lower-conflict states more quickly than initially assumed.
There is also a deeper analytical falsifier. The model decomposes price into baseline, shock premium, risk premium, and policy offset. That decomposition only remains useful if those layers are still distinguishable. If market pricing becomes dominated by panic overshoot, feedback trading, or broader macro contagion in ways that break the relationship between physical disruption and implied price premium, then the decomposition itself becomes less stable. In that kind of environment, the model may still be useful for scenario logic, but less reliable for clean premium separation.
That is why falsification matters. It reminds the reader that the OHK model is not a device for defending one number indefinitely. It is a framework for interpreting market states under changing assumptions. If those assumptions break, the interpretation should change with them. A credible Hormuz model should therefore be able to say not only what it currently sees, but what kinds of evidence would force it to admit that the market has moved into a different state of the world.
From Price to Premium: Separating Structural Oil Value from War, Insurance, and Logistics Distortion
A central advantage of a Hormuz stress model is that it allows the analyst to separate the underlying value of oil from the extra price created by disruption risk. That distinction is often lost in public discussion. Oil is usually spoken about as though it has one market price reflecting one market reality. In a chokepoint crisis, that is rarely true. The observed price is usually a composite. Part reflects normal supply-demand conditions. Part reflects actual physical loss or delay. Part reflects logistics stress. Part reflects insurance withdrawal. And part reflects fear itself. Unless those layers are separated, the analyst risks mistaking war noise for structural scarcity, or structural tightness for pure geopolitical premium.
This is why the OHK framework explicitly breaks price into baseline, shock premium, risk premium, and policy offset. The baseline asks what Brent would likely be if the market were driven mainly by inventories, demand, supply, spare capacity, and the futures curve. The shock premium asks what extra price is justified by actual net supply loss after rerouting, reserve releases, and alternate supply are taken into account. The risk premium asks what further addition comes from freight stress, insurer retreat, tanker delays, and escalation uncertainty. The policy offset then asks how much of that premium is reduced by reserve deployment, alternate sourcing, diplomacy, or a credible reopening path.
This breakdown matters because it reveals what kind of crisis the market is actually pricing. A market may appear to be pricing physical shortage when much of the move is really logistics premium. Or it may look calmer than it should because traders assume reserve releases will matter more than they actually can. A decomposition framework makes those differences visible. It can show, for example, that freight and insurance distortions are temporarily doing more work than direct production loss, or that the market is leaning too heavily on a reopening assumption that is not yet operationally credible.
There is also a practical policy benefit. If the premium is mostly structural, the response is different than if it is mostly risk-based. A structural premium points toward tighter physical balances and the need for supply or demand adjustment. A risk premium suggests that confidence restoration, shipping protection, reserve signaling, or convoy credibility may matter as much as barrels themselves. This is why decomposition is not only analytically elegant. It changes how governments, refiners, and investors understand the crisis they are facing.
The deeper lesson is simple: the observed oil price during a Hormuz shock is not one thing. It is a layered market signal in which fundamentals, logistics, and geopolitical anxiety are all being priced at the same time.
These are the core best-practice principles guiding the OHK framework: (i) decompose observed price into structural and shock-related components, (ii) distinguish physical shortage from logistics distortion, (iii) map different premium types to different policy responses, (iv) avoid treating one price as one explanation, and (v) ensure that every major premium can be traced to an explicit operational assumption.
Why Net Supply Loss Matters More Than Gross Headlines: The Discipline of Adjusted Disruption

One of the biggest analytical mistakes in energy-crisis commentary is to treat headline disruption as though it were the same thing as effective market loss. It is not. Gross disruption is only the first number. What matters more is net supply loss after bypass routes, reserve releases, alternate supply, and demand adjustment are taken into account. This is where public discussion often goes wrong. A headline may say that 8 million barrels per day are “at risk,” but that does not mean the market is actually facing an 8 million barrel per day shortfall. Some of that volume may be rerouted. Some may be replaced. Some may be covered temporarily by stocks. Some may simply never turn into effective loss at the consumer end. The job of the model is therefore not just to register the headline, but to translate gross stress into net stress.
That is why net supply loss sits at the center of the OHK framework. It is the variable that converts physical chokepoint strain into a market-relevant estimate. The logic is straightforward: start with gross disrupted volume, subtract what can still move through bypass infrastructure, subtract what can be covered by reserve release, subtract what can be added by alternate producers or nearby substitutions, and what remains is the true shortfall the market must absorb. That is the number that should drive price translation. It is far more meaningful than the original headline because it measures the actual deficit imposed on the consuming system rather than the total disruption at the source.
This discipline matters especially in the Hormuz setting because the world does have some partial cushions, even if they are too small to solve the problem entirely. Saudi westward capacity, the UAE Fujairah route, strategic reserves, and alternate supply responses all matter. They do not eliminate the shock, but they change its scale. A model that ignores them will overstate stress. A model that treats them as frictionless will understate it. The point is not to create false confidence. It is to force the forecast through a realistic mitigation chain rather than jumping directly from a dramatic headline to catastrophic pricing.
The same approach improves credibility. When the model places prices in one scenario range rather than another, the reasoning can be traced back to a net-loss assumption rather than a vague sense of fear. That makes the framework more useful for policy, more defensible in debate, and easier to update as conditions change. If reserve release proves weaker than expected, the net-loss number changes. If bypasses perform better than feared, the net-loss number changes again. In this way the model remains dynamic without losing interpretability.
The real forecasting gain comes when discussion shifts from dramatic gross-disruption headlines to the more disciplined question of how much supply is actually lost to the market after mitigation is counted.
For the OHK system, the analytical takeaway is straightforward: (i) center the framework on net supply loss rather than gross disruption headlines, (ii) treat rerouting and reserves as real but limited offsets, (iii) require every severe-price outcome to flow through an explicit mitigation chain, (iv) update scenarios as net-loss assumptions change, and (v) use adjusted disruption as the main bridge between physical events and market pricing.
The Limits of Live Anchoring: Why Real-Time Inputs Improve the Model Without Eliminating Judgment

A live-anchored model is a major improvement over a purely illustrative one, but it should not be mistaken for a self-sufficient machine. Once a spreadsheet is populated with current Brent, current war-risk conditions, current tanker stress, and current disruption assumptions, it can appear more objective than it really is. In reality, live anchoring reduces one class of error while leaving another intact. It brings the model closer to the market, but it does not remove the role of judgment, especially when some inputs remain proxied, some curves are incomplete, and scenario probabilities still depend on interpretation.
That is why the OHK live-anchored framework should be understood as a disciplined hybrid, not an automated oracle. Public data can tell us where Brent settled, how high shipping and insurance stress have risen, how many ships are delayed, and what official agencies assume about disruption duration. Those are important anchors. But even with that information, the analyst still has to decide how freight stress should translate into price pressure, how much weight to place on reserve-release assumptions, how much of the curve reflects genuine scarcity rather than panic, and what probability to assign to reopening versus prolonged conflict. Those are not simple data issues. They are judgment calls. A credible model should make them visible rather than pretend they do not exist.
This is not a weakness. It is the correct way to use the framework. Live anchoring is valuable because it narrows the space of arbitrary speculation and forces the model to confront current reality. But a chokepoint war is not a fully observable system. Some variables are measured directly, some are inferred, some are reported with delay, and some are inherently political. The strength of the framework lies in combining live market anchors with transparent assumptions, so the user can see where hard data ends and interpretation begins. In practical terms, the model’s inputs fall into three classes: directly observed variables such as spot Brent and publicly reported conflict or shipping indicators; derived or proxy variables such as parts of the stress layer, curve interpretation, or translated freight intensity; and judgmental scenario variables such as disruption duration, reopening probability, and scenario weights. Keeping those classes separate is crucial, because it allows expert readers to see which parts of the output rest on observation, which on inference, and which on explicit analyst judgment.
That transparency matters even more when the model is used by institutions rather than traders alone. Governments, importers, and strategic planners do not simply want a number. They want to know which parts of that number are tied to observable market conditions and which parts depend on scenario judgment. A model that separates those two layers is not weaker. It is more trustworthy.
The purpose of live anchoring is therefore not to eliminate judgment, but to discipline it — tying the model as closely as possible to observable market stress while keeping assumptions visible enough to be challenged, updated, and improved.
For the OHK system, the practical lesson is clear: (i) anchor the framework to live public market and conflict data wherever possible, (ii) disclose clearly where proxies are still being used, (iii) preserve a visible boundary between data and interpretation, (iv) treat live anchoring as an improvement in discipline rather than a substitute for judgment, and (v) design the model so that stronger future data can be integrated without breaking the architecture.
What a More Mature Version Would Look Like: From Live-Anchored Spreadsheet to Institutional Early-Warning System

The current OHK model is already useful as a structured decision tool, but its architecture also points toward a more mature next stage. In its present form, it is a live-anchored scenario system built in spreadsheet logic, with explicit decomposition, multiple scenario paths, and transparent assumptions. That is already a serious foundation. But the same design could evolve into something more ambitious: an institutional early-warning and stress-monitoring system. The distinction matters. A spreadsheet helps answer questions. A more mature system would watch the environment continuously, update scenario probabilities more systematically, and generate warning signals before the market narrative fully catches up.
A stronger future version would deepen three layers.
First, it would improve the market data layer. Instead of relying partly on manual inputs or transparent proxies, it would ingest live futures curves, options-implied volatility, crack spreads, freight indicators, and potentially shipping or AIS congestion data directly.
Second, it would improve the event and logistics layer. Rather than translating conflict conditions through broad manual scores alone, it would monitor observable indicators such as vessel queueing, insurer behavior, route deviations, and reserve-release announcements in near real time.
Third, it would improve the decision layer. Instead of simply presenting scenario outputs, it would connect them to action thresholds: what reserve policy is implied, what inflation-risk band has been entered, what level of alternate procurement becomes rational, and which infrastructure assumptions most reduce vulnerability.
Such a system would still not become perfect. It would continue to face the irreducible uncertainty of military escalation and political decision-making. But it would become far more useful as a planning architecture. It would move closer to the deeper purpose of the framework, which is not merely to forecast oil, but to show how chokepoint exposure becomes economic stress, how that stress can be measured, and what institutions should do differently as conditions deteriorate. That is the natural direction of the OHK approach. The model begins as a forecasting framework, but it matures into something broader: a system for connecting infrastructure vulnerability, market pricing, logistical strain, and policy response in one operational architecture.
The long-term value of the model lies not only in estimating oil prices under stress, but in evolving into an early-warning framework that
helps institutions see the next layer of vulnerability before
the market fully prices it.
This leads directly to five design principles in the OHK framework: (i) treat the spreadsheet as the first operational layer rather than the final destination, (ii) aim toward stronger live-data integration and better event detection, (iii) connect scenario outputs to decision thresholds and policy triggers, (iv) evolve the model from forecast engine into early-warning system, and (v) preserve interpretability as the system becomes more sophisticated.
How the Spreadsheet Was Built: Workbook Architecture, Formula Logic, and Why the OHK Model Is Organized This Way—Turning Hormuz Disruption into a Transparent Oil Stress Model

A model like this is only useful if its logic is visible. For that reason, the OHK Hormuz Oil Stress Model was built not as a black-box program, but as a structured spreadsheet framework in which the architecture, assumptions, and calculation flow can all be inspected directly. The purpose of the workbook is not only to generate scenario outputs, but to show clearly how those outputs are produced. That transparency matters in a crisis setting. When oil prices are being shaped by war, logistics, insurance, reserves, and policy response at the same time, users need to see where the number comes from, what assumptions sit beneath it, and which elements are live anchors versus modeled layers.
The workbook was organized into a set of linked sheets, each with a distinct function. One layer captures daily market and shipping inputs such as Brent, parts of the futures curve, tanker stress, war-risk insurance, and visible transport disruption. A second layer captures slower-moving structural variables such as inventories, supply, demand, spare capacity, and broader market balance. A third layer produces the baseline market estimate. A fourth sheet translates Hormuz-specific disruption into net supply loss, freight stress, insurance premium, and risk-adjusted price pressure. A fifth layer applies scenario logic, converting the same market into different states such as base conflict, mild disruption, severe disruption, closure with reopening, prolonged conflict, and de-escalation. The workbook then aggregates those scenarios into dashboard-style outputs and a probability-weighted estimate, while also preserving a calibration and assumptions structure so that inputs can be revised without changing the overall architecture.
The core calculation logic was deliberately kept simple and decomposable. Instead of trying to predict Brent through one hidden equation, the spreadsheet separates price into four components: baseline, shock premium, risk premium, and policy offset. In spreadsheet terms, that means first estimating what oil might roughly be worth under normal structural conditions, then adding the premium associated with actual lost or delayed barrels, then adding the premium associated with freight, insurance, and escalation stress, and finally subtracting whatever offset might come from reserves, alternate supply, diplomacy, or reopening assumptions. This design makes the workbook easier to audit and more useful for institutional users, because it allows them to change one assumption at a time and see which part of the final price moves. If reserve release assumptions improve, the policy offset changes. If war-risk premiums rise, the risk premium changes. If net supply loss falls because bypass capacity is more effective than expected, the shock premium changes. That is exactly the kind of clarity a crisis model needs.
The spreadsheet was also built around the distinction between live anchors, transparent proxies, and scenario judgment. Live anchors are the values tied directly to current public reporting, such as observed Brent, reported war-risk conditions, publicly reported shipping stress, or visible disruption indicators. Transparent proxies are the fields that the workbook still needs in order to function coherently but that are not always available in the right live public format, such as parts of the futures curve, some crack or volatility assumptions, and some freight translations. Scenario judgment then sits above both, assigning weights and states of the world in light of current conditions. The important point is not that every cell is “live,” but that the workbook makes visible which cells are observed, which are proxied, and which are judgmental. That distinction is part of the governance of the model, not a minor technical note.
In practical terms, the spreadsheet was designed to do three things at once. First, it can run as a live-anchor interpretation tool, helping explain what the market appears to be pricing on a known date. Second, it can run as a forward scenario workbook, allowing assumptions about disruption, reserves, insurance, and reopening to be changed in order to test future price ranges. Third, it can run as a stress-testing framework, helping decision-makers compare what happens under different net-loss or mitigation assumptions. That multi-use design is intentional. In a Hormuz crisis, the same workbook must be able to explain, forecast, and stress-test without pretending that those are all the same exercise.
The value of the OHK spreadsheet lies not only in the numbers it produces, but in the transparency of how it turns live market anchors, physical disruption, and scenario judgment into an auditable map of conditional oil-price outcomes.
The broader point is that the spreadsheet was not built merely to calculate a result. It was built to discipline the process by which a result is reached. That is why the workbook matters as part of the OHK approach. It operationalizes the article’s central argument: that in a live chokepoint crisis, the task is not to produce one magical oil-price number, but to build a transparent decision framework in which baseline conditions, disruption stress, logistics effects, and policy responses can be separated, tested, and compared.
Close-Out: A Hormuz Model Is Valuable Only If It Makes the Crisis More Legible
The real achievement of a Hormuz oil model is not that it produces a more impressive number. It is that it makes a complicated crisis easier to read. A good model should reduce confusion, not add to it. It should help the user distinguish which part of the price reflects normal market structure, which part reflects actual supply disruption, which part reflects insurance and freight stress, which part is being offset by reserves or alternate supply, and which part remains a projection of fear into an uncertain future. That is what turns modeling from a technical exercise into something strategically useful.
This is ultimately why the OHK approach matters. It does not begin from the illusion that oil in a chokepoint war can be forecast in the same way as a normal commodity cycle. It begins from the recognition that the problem is layered. Hormuz compresses physical flow, military risk, logistics strain, policy response, and market psychology into one narrow geography. Any serious model for that setting has to hold those dimensions together without pretending they are the same thing.
The result is a more disciplined form of forecasting. It is humbler in one sense, because it openly admits what it cannot predict. But it is stronger in another, because it gives institutions a clearer map of what can be estimated, which assumptions drive outcomes, and where the real vulnerabilities lie. In a crisis like this, that is more valuable than the theater of false precision.
A serious Hormuz model earns its value not by pretending to know
the future, but by making the structure of uncertainty clear
enough that governments, investors, and planners can act with greater discipline inside it.
For OHK, the final lesson is straightforward: (i) use modeling to clarify crisis structure rather than create false certainty, (ii) keep every major price outcome tied to explicit physical and logistical assumptions, (iii) treat uncertainty as part of the object being modeled, (iv) design the framework for institutional use rather than point-forecast theater, and (v) ensure that the final output helps decision-makers act earlier and more coherently under stress.
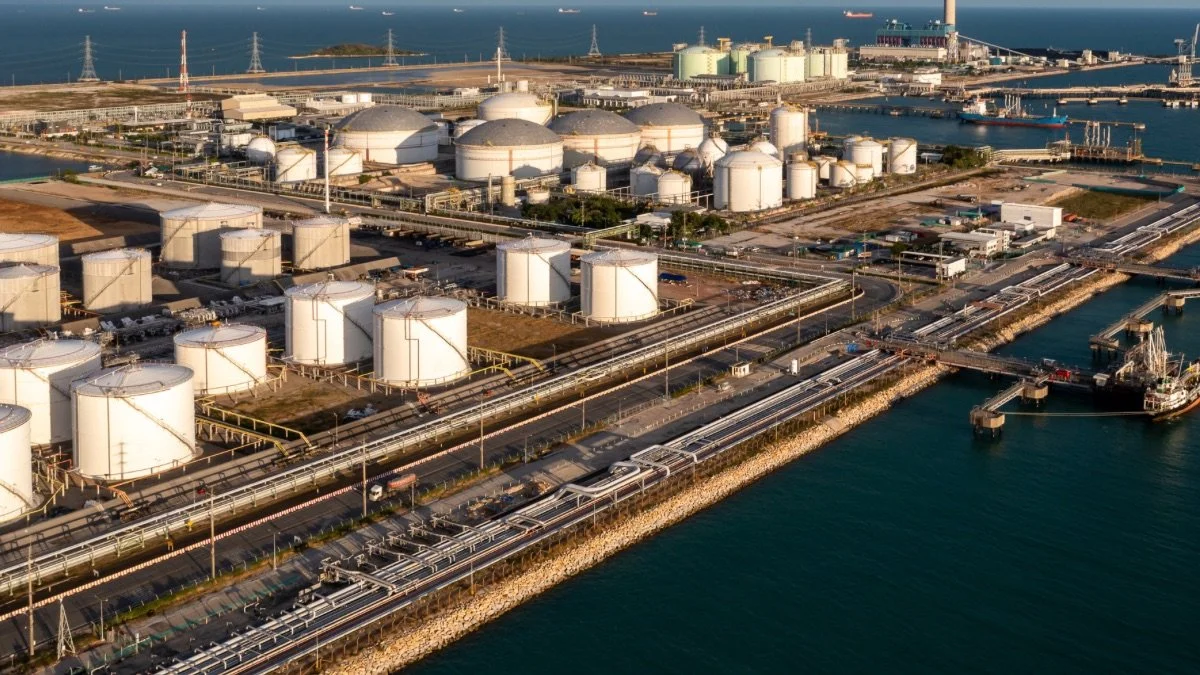
Summary of Methods for Data Specialists:
This model is a live-anchored scenario model, not a fully automated market terminal or a pure statistical forecasting engine. In plain terms, that means the model was updated using a small number of current, externally reported market and conflict indicators as anchors, while other fields were filled using transparent, clearly documented proxy assumptions so that the workbook could run as a coherent stress-testing tool. The goal is not to pretend that every input is live-ticked; it is to combine the most decision-relevant current facts with a structured framework for estimating how different Hormuz disruption scenarios might affect Brent.
The main live anchors are the inputs that were directly tied to current public reporting. These include the Brent crude settlement of $100.46/bbl on March 12, 2026, the fact that Brent briefly rose above $119/bbl earlier in the week, the increase in war-risk insurance from roughly 0.25% before the conflict to as high as 3% of vessel value, and the report that around 150 ships were stranded or delayed around Hormuz. The model also uses current public guidance from the U.S. EIA, which says Brent is expected to remain above $95/b for the next two months under its conflict assumptions before easing later in the year. These values anchor the model to the present market and conflict environment rather than leaving it as a purely hypothetical template.
Some inputs remained transparent proxies rather than direct live feeds. These include parts of the Brent futures curve, some product crack spread assumptions, the oil-volatility input, parts of the freight-stress index, and the LNG spot stress translation. These were not invented arbitrarily; they were set to levels that were directionally consistent with the live anchors and with current reporting on tanker costs, LNG freight stress, and the expected easing path implied by EIA’s outlook. They are called “transparent proxies” because they are visible in the workbook, can be changed by the user, and are meant to be understood as practical approximations rather than hidden or falsely precise live market prints.
The model has three layers. The first is the baseline market layer, which estimates where Brent might trade absent a major new escalation in Hormuz. It uses core oil-market logic such as the current price level, curve shape, inventories, supply-demand balance, and spare capacity. The second is the Hormuz shock layer, which translates disruption into price pressure by looking at gross lost barrels, rerouting capacity, stock releases, shipping delays, freight stress, and war-risk insurance. The third is the scenario layer, which combines these variables into named pathways such as base case, mild disruption, severe disruption, closure with gradual reopening, prolonged conflict, and de-escalation. This structure matters because a single time-series model is not well suited to war-driven chokepoint shocks; official forecasters themselves are currently conditioning oil-price outlooks on assumed conflict duration and outage paths.
Scenario probabilities were assigned using judgment informed by current market conditions, not by claiming a fully objective statistical probability distribution. In practice, this means the model gives more weight to outcomes that look closest to the current market state and less weight to extreme outcomes unless current evidence strongly supports them. For example, because spot Brent is around $100/bbl, shipping is clearly under stress, and insurance costs have surged, the model gives meaningful weight to mild and base disruption scenarios. At the same time, it assigns lower but nonzero probability to severe disruption, effective closure, and prolonged conflict, because those outcomes remain possible even if they are not yet the central market assumption. De-escalation also retains a meaningful probability because the literature and official forecasts both show that oil risk premiums can unwind quickly if flows normalize. This approach is closer to structured analyst judgment than to a pure probabilistic market-implied model.
What the model can claim is that it provides a disciplined way to separate a baseline oil value from a Hormuz risk premium, compare the effects of different outage assumptions, estimate plausible Brent ranges under different disruption states, and show how much bypass routes, stock releases, and de-escalation might matter. It is useful for scenario analysis, stress testing, and policy or strategic discussion. It can help answer questions like: what might Brent look like if net supply loss rises from 2 mb/d to 6 mb/d, or if war-risk premiums remain elevated for 60 days instead of 10?
What the model cannot claim is that it can predict the exact path of war, diplomacy, military escalation, or market psychology with precision. It cannot know the day of a new strike, the timing of an insurance withdrawal, or the exact moment of a political breakthrough. It also cannot honestly claim that every input is a live market feed, because some variables are still proxies. So the model should be read as a live-anchored decision model, not as a perfect forecasting machine. Its value lies in making assumptions explicit, comparable, and revisable as new information arrives.
A further implication of this method is that the model should be read as a conditional framework rather than a single “correct” forecast. If the underlying conflict assumptions change, the price outputs should change with them. For example, if bypass capacity proves more usable than expected, if strategic reserves are released faster, or if shipping normalizes sooner, the model should pull Brent down quickly. If instead disruption persists, tanker availability tightens further, and insurance remains impaired, the model should shift toward the severe or prolonged-conflict range. In that sense, the model’s purpose is not to eliminate uncertainty, but to organize it.
This also explains why the workbook uses named scenarios rather than a single forward path. In a normal commodity environment, one can sometimes rely more heavily on time-series behavior, futures signals, or inventory models. In a wartime chokepoint environment, however, those tools need to be supplemented by structured assumptions about physical disruption, policy response, and market stress transmission. The scenario design is meant to make that explicit. Each path represents a coherent combination of physical flows, insurance conditions, freight stress, reserve use, and reopening assumptions, rather than a purely statistical extrapolation of yesterday’s price move.
Users should therefore treat the scenario probabilities as working weights, not as objective truth. They are best understood as a disciplined way of saying, “Given what we know now, this is roughly how much weight we assign to each state of the world.” Those weights should be revised as new evidence emerges. A new diplomatic channel, a change in military posture, confirmation of larger outages, or a successful reopening of traffic should all lead to probability changes. In this sense, the model is designed to be updated iteratively, not consulted once and treated as final.
The model is strongest when used for comparison and decision support. It is useful for comparing the effect of a 2 mb/d net loss against a 6 mb/d net loss, or a two-week disruption against a two-month one. It is also useful for testing how much difference is made by emergency stock releases, alternative export routes, or rapid de-escalation. These are exactly the types of questions policymakers, analysts, investors, and infrastructure planners need to ask in a Hormuz-type crisis. The workbook helps frame those questions numerically and transparently.
It is weakest when asked to do something it was not built to do. It should not be used as if it were a black-box machine that can forecast the next military action, the exact timing of diplomatic breakthroughs, or the precise daily closing price of Brent. It also should not be treated as if every number inside it were equally observed and equally certain. Some variables are measured directly, others are inferred, and others are scenario assumptions. That distinction is not a flaw; it is part of being honest about what this kind of model can realistically accomplish.
In summary, the model should be understood as a live-anchored, scenario-based stress model for oil under chokepoint disruption. It combines current market and conflict anchors with transparent assumptions to estimate plausible price ranges under different Hormuz outcomes. Its value lies in clarity, flexibility, and comparability. Its limitations lie in the fact that war, shipping disruption, and political response are not fully forecastable by any spreadsheet. The model is therefore most credible when used as a structured decision tool: explicit about assumptions, modest about certainty, and designed to be revised as events unfold.
At OHK, we approach questions like Hormuz not only as infrastructure and geopolitical challenges, but also as modeling and decision problems. Our work combines management consulting, spatial analysis, data systems, and strategic planning to help clients move from fragmented information to actionable judgment. We build frameworks that connect physical infrastructure, market exposure, institutional capacity, and scenario-based risk into one coherent picture, allowing governments, development institutions, and private sector leaders to test alternatives rather than react blindly to crisis. Whether the issue is corridor resilience, urban systems, investment strategy, or policy reform, our aim is the same: to turn complex data into clearer decisions, stronger institutions, and more durable long-term outcomes. Contact OHK to learn how our analytical, planning, and modeling capabilities can support better infrastructure, policy, and investment decisions in a more uncertain world.