

Beyond Hype: Measuring the Real Impact of Artificial Intelligence on Jobs, Sectors, Economies, and Cities
Introducing a multi-dimensional analytical framework that distinguishes AI’s technical potential from economic reality to assess structural workforce transformation.
This article is Part III of our three-part blog series on AI, layoffs, and the future of work, building on Part I’s exploration of how artificial intelligence is reshaping work and the strategic forces driving organizational redesign, and Part II’s examination of how AI’s impact varies across sectors and countries. In this final installment, we present the analytical framework and metrics used to move beyond headline claims and rigorously assess automation exposure across industries and economies, separating technological possibility from economic reality. Refer to Part I here, and Part II here.
Reading Time: 45 min.
All illustrations are copyrighted and may not be used, reproduced, or distributed without prior written permission.
Summary: Part III focuses on how to move beyond headlines and hype to measure the real workforce impact of artificial intelligence in a structured and credible way. We introduce OHK’s Multi-Dimensional AI Workforce Impact Framework, a comprehensive analytical system designed to distinguish technical automation potential from real-world economic outcomes. Spanning eleven integrated indices—including displacement exposure, augmentation intensity, adoption velocity, workforce transition capacity, institutional restructuring speed, capital-market amplification, national economic exposure, and spatial urban resilience — the framework captures how AI transmits through labor markets, organizations, financial systems, and cities. Rather than predicting headline job losses, it maps structural vulnerability, transformation trajectories, and resilience across sectors and economies. The approach reveals where automation will compress labor, where productivity will primarily augment human work, where social risk accumulates, and where economic value remains anchored in human presence. The result is a realistic, strategy-ready view of AI’s true impact on the future of work beyond speculative narratives.
A Multi-Dimensional Framework for Measuring AI’s Structural Impact on Work
Artificial intelligence is reshaping work through multiple interconnected mechanisms, not a single channel of job replacement. While popular discourse often reduces AI’s labor impact to headline forecasts of jobs lost or created, real transformation unfolds across task substitution, workflow redesign, productivity amplification, capital reallocation, organizational restructuring, and shifting skill demand. Capturing this complexity requires moving beyond one-dimensional metrics toward a structured, multi-layer framework that reflects how modern operating models actually evolve.
OHK’s Multi-Dimensional AI Workforce Impact Framework measures transformation across several core dimensions: technical automation exposure, augmentation intensity, adoption velocity, workforce transition elasticity, human value density, capital signaling pressure, and the gap between theoretical exposure and real-world restructuring outcomes. Together, these metrics map not only where AI can replace work, but where it enhances human productivity, how fast it diffuses across sectors, how labor markets absorb disruption, and where narrative momentum accelerates change beyond operational reality.
At its foundation lies task-level analysis—decomposing roles into work activities and assessing each for automation feasibility and substitution potential. But the framework extends further, incorporating economic friction, institutional behavior, organizational redesign patterns, and labor mobility dynamics that determine whether technical potential translates into actual workforce compression or sustainable transformation. This layered approach recognizes that automation does not act in isolation; it interacts with capital markets, regulatory systems, corporate incentives, and human skill pipelines.
Rather than producing a single “jobs at risk” figure, the framework generates a structural profile of AI’s impact across sectors and economies: where displacement pressure is high, where work is primarily augmented, where transformation will occur rapidly versus gradually, and where social and operational risk is most likely to emerge. The result is a realistic, policy-relevant, and strategy-ready view of the future of work — one that reflects the economic mechanics of technological change rather than speculative headlines. In essence, OHK’s framework treats AI not as a binary force, but as a systemic reorganizer of work itself, reshaping how value is produced, how organizations are structured, and how human effort is leveraged alongside intelligent systems.
Why a Multi-Dimensional Approach Is Necessary
Single-metric forecasts of AI-driven job loss consistently misrepresent both the scale and nature of workforce transformation. Early occupation-level studies suggested massive displacement waves, while later task-based research revealed far more nuanced outcomes, with most roles undergoing partial automation rather than elimination. Yet even task-level exposure alone remains insufficient. Technical feasibility does not automatically produce layoffs, and measured productivity gains do not always translate into workforce reduction.
What determines real-world impact is the interaction between technology, economics, institutions, and organizational behavior. Adoption speed varies dramatically across sectors due to capital constraints, regulatory oversight, infrastructure maturity, and risk tolerance. Some industries absorb automation as efficiency gains and reinvest labor into higher-value work, while others translate it directly into headcount compression. Labor markets differ in their capacity to reskill and reallocate displaced workers. Meanwhile, capital markets increasingly reward visible automation narratives, accelerating restructuring beyond what productivity improvements alone might justify.
Without capturing these dynamics, any single metric risks either overstating disruption or missing emerging structural pressure. Displacement exposure may be high while layoffs remain minimal due to regulation or redesign. Conversely, layoffs may surge where automation maturity is still limited but narrative incentives are strong. Augmentation-driven transformation can quietly reshape entire sectors without headline job losses, altering skill demand and organizational structures in ways traditional metrics fail to detect.
A multi-dimensional framework is therefore essential to distinguish sustainable transformation from hype-driven restructuring, to identify where workforce compression reflects genuine productivity gains versus financial signaling, and to understand where social risk accumulates due to weak transition pathways. It allows leaders, policymakers, and investors to anticipate not only where automation is technically possible, but where it will materialize, how fast, and with what economic and human consequences. In short, AI’s impact on work is not a single curve—it is a system of interacting forces. Measuring it responsibly requires tools that reflect that systemic reality.
How the Framework Builds Directly on Parts I and II
Part I established that AI-era layoffs are no longer merely cyclical cost responses, but signals of operating-model redesign shaped by strategic forces and often amplified by narrative and capital market dynamics. It introduced the idea that workforce compression can reflect genuine automation-driven productivity — or bubble-like momentum divorced from operational reality.
Part II demonstrated that AI disruption is structurally uneven, following task structure, digital feasibility, human value dependence, and regulatory friction across sectors and countries. It showed where automation accelerates rapidly and where it slows or augments rather than replaces.
The Multi-Dimensional Framework in Part III integrates these insights into a measurable system. Displacement Exposure operationalizes the structural vulnerability mapped in Part II. Adoption Velocity and Human Value Density explain why disruption progresses faster in some sectors than others. Workforce Transition Elasticity captures the social and economic consequences hinted at in national exposure patterns. Capital Signaling Sensitivity and the Realization Gap translate the bubble dynamics of Part I into observable metrics.
Together, the three parts form a coherent analytical arc:
Part I explains the new logic driving workforce transformation.
Part II maps where that logic applies most intensely.
Part III quantifies how it unfolds in reality.
The result is a comprehensive, structurally grounded approach to understanding AI’s real impact on work — beyond hype, beyond single metrics, and beyond simplistic job-loss narratives.
What the Framework Looks Like in Practice
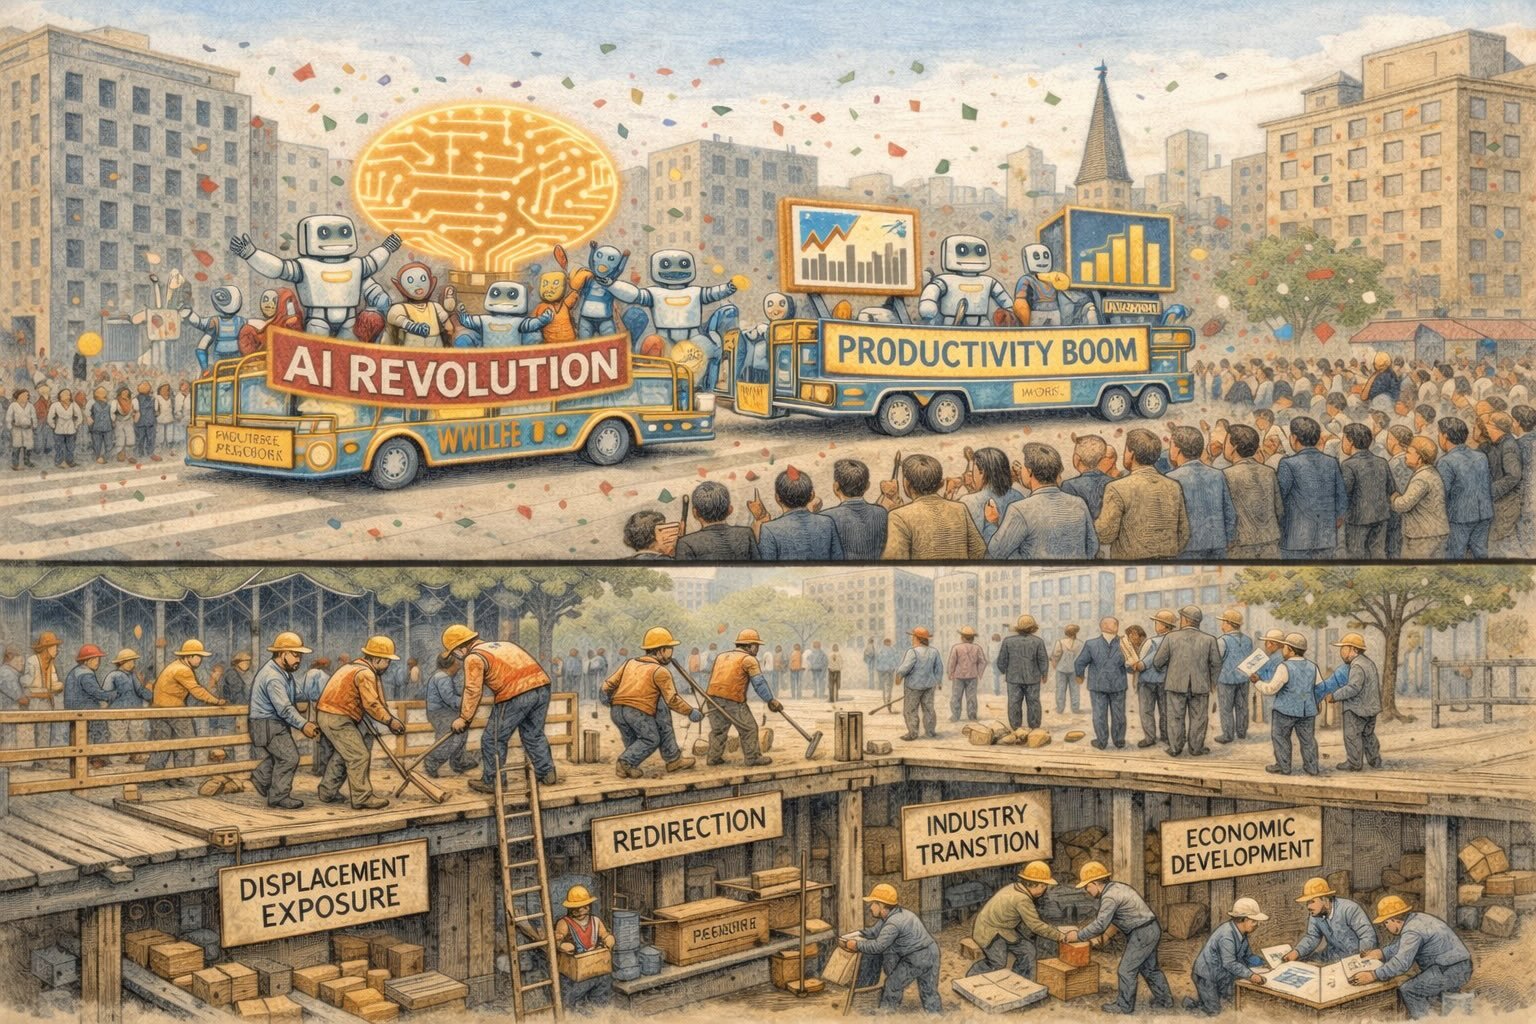
To move beyond simplistic “jobs lost” narratives, OHK developed an eleven-metric, multi-dimensional framework that captures how artificial intelligence actually reshapes work across sectors, economies, and institutions. Rather than focusing on a single automation score, the framework measures technical feasibility, organizational redesign, labor market absorption, economic friction, and capital-driven acceleration. Together, these eleven indices reflect the full system through which AI translates from technological potential into real workforce transformation. The goal is not prediction of headlines, but structural insight — revealing where displacement pressure is building, where augmentation dominates, where transition risks emerge, and where narrative momentum may be driving change faster than operational reality supports.

This illustration represents the measure of the technical limits of human work in the AI era. The human–machine spectrum visualizes where tasks shift from judgment-heavy, adaptive roles toward fully codified, automatable processes. DEI exists because disruption cannot be inferred from headlines or investment alone; it must be measured at the task level. Where work is digital, standardized, and rules-based, exposure rises sharply. By quantifying that exposure, DEI helps distinguish genuine substitution risk from sectors where human value remains structurally indispensable.
1) Displacement Exposure Index (DEI): Measuring the Technical Limits of Human Work in the AI Era
Definition: the share of work activity within a sector, organization, or economy that is technically feasible for AI-driven substitution of core tasks under current or near-term technological capabilities.
The Displacement Exposure Index (DEI) measures how much of the work performed across roles, industries, or economies is structurally vulnerable to automation and AI substitution. Rather than treating jobs as single units that disappear or survive, DEI operates at the task level, recognizing that most roles consist of bundles of activities — some highly automatable, others deeply human. By quantifying the proportion of daily work-hours that AI can technically perform, DEI reveals where artificial intelligence has the potential to compress labor demand most aggressively if organizations redesign workflows accordingly.
At its core, DEI reframes the automation debate away from sensational job-loss counts and toward structural exposure of work itself. A high DEI score does not imply immediate layoffs. It indicates that large portions of routine, standardized, or digitizable activity within a system are technically replaceable by intelligent systems. Whether this exposure translates into workforce reduction depends on adoption speed, organizational strategy, regulatory constraints, and labor transition capacity — captured by other indices in OHK’s multi-dimensional framework.
What DEI Measures. DEI evaluates displacement exposure across five integrated task dimensions. First, it assesses Digitizability, measuring whether a task is already performed in digital form or can be converted into structured data processes. Tasks embedded in digital workflows — such as data analysis, document processing, customer inquiries, scheduling, and coding — score high on exposure. Second, it measures Routineness and Standardization, capturing how predictable, repetitive, and rule-based an activity is. Highly standardized procedures with clear inputs and outputs are far easier to automate than complex judgment-driven work. Third, DEI incorporates Decision Codifiability, evaluating whether outcomes can be governed by explicit rules, probabilistic models, or pattern recognition systems rather than contextual human reasoning. Fourth, it accounts for Regulatory and Accountability Constraints, recognizing that even technically automatable tasks may require human oversight due to legal, ethical, or safety requirements — particularly in healthcare, finance, and public services. Finally, it integrates Human Essentiality, measuring reliance on empathy, trust, creativity, physical presence, or moral judgment — domains where substitution remains structurally limited. Together, these dimensions determine how much of a role’s activity is technically substitutable rather than augmentable.
How the Index Is Built: DEI is constructed through task-level decomposition and weighted aggregation. Each role within a sector or organization is broken into its core daily activities. Each activity is scored across the five exposure dimensions above, producing an automation feasibility rating. These scores are then weighted by the proportion of time spent on each task, aggregated across roles, and scaled by employment distribution. At the sector or national level, role exposure scores are further weighted by labor composition using standardized economic classifications such as the UN ISIC framework. Results are expressed as ranges rather than single point estimates, reflecting uncertainty around adoption pace, system integration, and organizational redesign. Importantly, DEI reflects technical feasibility of substitution, not projected job losses.
What DEI Enables: DEI allows decision-makers to see where structural automation pressure is building beneath the surface of labor markets. It highlights which industries face deep compression potential, where operating models are most vulnerable to redesign, and which functions are likely to disappear or shrink first. It helps governments anticipate reskilling demand, firms prioritize transformation strategies, and investors understand long-term labor efficiency shifts embedded in business models. DEI also explains why some sectors experience rapid AI-driven restructuring while others remain largely stable — a pattern expanded in Part II.
Who Uses It: Primary users include national governments, labor ministries, workforce development agencies, corporate strategy teams, technology transformation leaders, institutional investors, and development banks. It is particularly valuable for policy planning, corporate operating-model redesign, automation investment prioritization, and long-term economic resilience analysis.
Why It Matters: Most automation narratives still revolve around simplistic claims of “X million jobs at risk.” DEI replaces that with a structural, evidence-based view of work vulnerability. It shows that AI rarely eliminates entire occupations overnight — instead it removes large clusters of routine activity, compressing junior roles, administrative layers, and standardized knowledge work first. Over time, this fundamentally reshapes labor demand, organizational hierarchies, and productivity economics. By focusing on work-hours rather than job titles, DEI captures the real mechanism through which AI transforms economies. In essence, DEI measures where the economic foundations of labor are technically eroding — long before layoffs become visible.
Use Case — Applying DEI in Practice: A national labor ministry wants to anticipate where AI-driven workforce pressure will emerge first, beyond headline layoffs. Using DEI, it decomposes major employers across technology, finance, public administration, and logistics into role-based task bundles and estimates the share of work-hours that are technically substitutable under near-term AI capability. The results show very high exposure in customer operations, back-office processing, and junior analytical work, but lower exposure in frontline care, education delivery, and tourism services. The ministry then targets reskilling funds, wage-transition support, and apprenticeship redesign toward the most exposed task clusters before displacement becomes visible.
Note: In Part II, OHK first introduces and applies its Displacement Exposure Index (DEI) to map sector-level automation vulnerability through task-based analysis. These empirical results establish the structural unevenness of AI disruption across the economy. Part III then situates DEI within OHK’s broader Multi-Dimensional AI Workforce Impact Framework, expanding it alongside complementary indices that capture adoption speed, workforce transition capacity, institutional dynamics, capital-market amplification, and spatial economic resilience.

This illustration represents the degree to which artificial intelligence amplifies human productivity rather than replacing labor. The many hands reflect how AI extends human capacity across analysis, coordination, creativity, and execution, allowing one worker to perform the output of many. Measuring AII matters because not all automation destroys jobs; in many sectors it multiplies impact, compresses layers, and reshapes roles. Where AII is high, productivity surges without mass displacement.
2) Augmentation Intensity Index (AII): Where AI Multiplies Human Productivity Rather Than Replaces Labor
Definition: the share of work activity within a sector, organization, or economy where artificial intelligence primarily enhances human productivity, decision quality, speed, or reach without substituting human accountability or presence.
The Augmentation Intensity Index (AII) measures the extent to which AI functions as a human leverage engine rather than a labor replacement tool. While displacement-focused metrics identify where tasks can be substituted, AII captures where intelligent systems amplify human output — enabling professionals to work faster, more accurately, at greater scale, and with deeper analytical insight while remaining central to value creation. In these environments, automation reshapes workflows and productivity economics without triggering large-scale job elimination.
At its core, AII reflects the reality that much of AI’s economic impact comes not from removing workers, but from multiplying what each worker can produce. Surgeons supported by diagnostic AI, teachers aided by personalized learning systems, managers using predictive analytics, designers leveraging generative tools, and hospitality staff supported by intelligent operations platforms all operate within high-augmentation environments. These sectors often experience deep transformation with stable or even growing employment — but radically changing skill requirements.
What AII Measures: AII evaluates augmentation intensity across five integrated dimensions.
First, it measures Decision Support Depth, capturing how extensively AI improves analysis, forecasting, diagnostics, and insight generation without replacing human judgment. Second, it assesses Workflow Acceleration, quantifying how much time AI removes from routine preparation, documentation, search, and coordination tasks — freeing humans for higher-value activity. Third, it incorporates Scale Enablement, reflecting where AI allows individuals or small teams to operate at volumes previously requiring much larger workforces. Fourth, AII evaluates Creative and Strategic Enhancement, measuring how generative systems expand ideation, scenario testing, and problem-solving capacity. Finally, it integrates Human Accountability Persistence, ensuring augmentation is counted where responsibility, trust, and final decisions remain human-led. Together, these factors determine how strongly AI functions as a productivity multiplier rather than a substitution mechanism.
How the Index Is Built: AII is built through task-role augmentation mapping. Each role is decomposed into core activities and evaluated for the degree to which AI improves speed, accuracy, scale, or insight while preserving human responsibility. Tasks that remain human-led but are materially enhanced by AI score high on augmentation intensity. These task scores are weighted by time share and aggregated across roles and employment distribution. Like DEI, results are expressed as ranges to reflect adoption variability and organizational redesign scenarios. Importantly, AII measures productivity transformation, not job creation or loss.
What AII Enables: All reveals where AI investment will produce the largest productivity returns without workforce collapse. It helps organizations prioritize augmentation technologies, design re-skilling programs, anticipate changing skill demand, and identify sectors where human-AI collaboration becomes the dominant operating model. For policymakers, AII highlights where employment stability is likely alongside major skill transitions.
Who Uses It: Primary users include employers, education systems, reskilling institutions, technology strategists, development agencies, productivity analysts, and labor ministries.
Why It Matters: Focusing only on displacement ignores the main engine of AI-driven economic growth: productivity amplification. High-augmentation sectors may not shrink — but they transform profoundly, demanding new competencies, faster execution, and redesigned workflows. Without measuring augmentation, societies risk underinvesting in skills where the largest economic value will emerge. In essence, AII captures where AI turns human effort into high-leverage economic power rather than obsolete labor.
Use Case—Applying AII in Practice: A large healthcare network wants to modernize operations without reducing clinical staff. Using AII, it maps diagnostic support systems, automated documentation tools, predictive scheduling, and AI-assisted treatment planning across departments. The analysis reveals extremely high augmentation in radiology, patient flow management, and clinical decision support, where doctors treat more patients with higher accuracy while retaining accountability. Rather than cutting roles, leadership redirects investment into AI-enabled training, workflow redesign, and productivity-based performance models, achieving major efficiency gains while improving care quality and preserving employment stability.
This illustration visualizes the speed at which technical feasibility translates into real workforce transformation. The fast-moving walkway represents how quickly automation can be deployed once tools mature, while the sparse arrival zone reflects how slowly labor markets, institutions, and skills systems adjust. Measuring this velocity matters because disruption is not driven by technology alone, but by how rapidly organizations restructure around it. Where AVI is high, displacement accelerates; where it is low, transformation unfolds gradually.
3) Adoption Velocity Index (AVI): The Speed at Which AI Feasibility Becomes Workforce Transformation
Definition: the rate at which technically feasible AI automation and augmentation are converted into real operational deployment and workforce impact across sectors, organizations, and economies.
The Adoption Velocity Index (AVI) measures how quickly artificial intelligence moves from technical capability into widespread organizational use that materially reshapes workflows, productivity, and labor demand. While indices such as DEI identify where automation is possible and AII highlights where AI enhances human output, AVI captures the crucial transmission mechanism: how fast change actually happens. Two sectors may share identical automation exposure, yet experience radically different outcomes depending on capital availability, regulatory environment, organizational readiness, and infrastructure maturity.
At its core, AVI reflects the reality that technology alone does not transform economies — institutions, incentives, and systems determine the pace of transformation. High-velocity environments convert AI feasibility into operational reality within months. Low-velocity environments may take years or decades, even when technology is fully capable. Understanding this speed differential is essential for forecasting disruption, planning transitions, and managing economic risk.
What AVI Measures: AVI evaluates adoption speed across five integrated structural drivers.
First, it measures Capital Deployment Intensity, capturing investment in AI systems, cloud infrastructure, automation platforms, data engineering, and digital transformation programs relative to sector size. Second, it assesses Workflow Digitization Maturity, reflecting how much work is already embedded in digital systems where AI can be layered quickly versus physical or hybrid environments that require long integration cycles. Third, AVI incorporates Regulatory and Governance Friction, evaluating how legal frameworks, compliance requirements, risk tolerance, and oversight slow or accelerate automation adoption. Fourth, it measures Organizational Transformation Capacity, including management capability, change readiness, data availability, and system integration competence. Finally, it integrates Technology Accessibility and Cost Trajectory, reflecting whether AI tools are scalable, affordable, and readily deployable across firms rather than confined to frontier adopters. Together, these drivers determine whether AI transformation occurs rapidly, gradually, or stalls despite technical feasibility.
How the Index Is Built: AVI is constructed through adoption-readiness and diffusion mapping. Each sector or organization is scored on capital investment trends, digital infrastructure penetration, regulatory complexity, organizational maturity indicators, and technology cost curves. These are combined into a velocity profile indicating expected speed of operational rollout. Rather than producing a single timeline, AVI generates acceleration scenarios — rapid conversion environments, moderate diffusion environments, and slow-transition environments. This allows forecasting of near-term versus long-term disruption windows.
What AVI Enables: AVI helps leaders understand when AI-driven transformation will hit — not just where it is technically possible. It supports workforce planning timelines, infrastructure investment sequencing, regulatory readiness, and economic shock absorption strategies. For businesses, it clarifies which units will transform first and where pilot programs will scale fastest.
Who Uses It: Primary users include governments, regulators, corporate transformation leaders, investors, development banks, and workforce planners.
Why It Matters: Most automation models implicitly assume instantaneous adoption. In reality, speed determines social impact. Fast adoption can overwhelm reskilling systems and labor markets. Slow adoption creates adaptation windows and smoother transitions. Without measuring velocity, policymakers either panic prematurely or react too late. In essence, AVI explains why some economies feel AI disruption immediately while others experience gradual reshaping — even with identical technology.
Use Case—Applying AVI in Practice: A national economic planning agency wants to anticipate which industries will experience AI-driven restructuring within the next three years versus over the next decade. Applying AVI, it finds extremely high velocity in finance, digital services, and customer operations due to heavy investment, mature digital workflows, and low regulatory friction. Manufacturing and healthcare show slower velocity due to infrastructure constraints and compliance oversight. Using these timelines, the government sequences reskilling programs, regulatory modernization, and social protection funding to match actual transformation speed rather than reacting after layoffs surge.
This illustration highlights why workforce transition elasticity must be measured, not assumed, in the age of AI-driven disruption. As automation accelerates, workers are pushed off existing roles at uneven speeds, but national labor systems differ radically in their ability to absorb shock through reskilling, mobility, and institutional support. Where transition capacity is strong, displacement becomes reintegration and productivity renewal. Where it is weak, automation translates into unemployment and social strain.
4) Workforce Transition Elasticity Index (WTEI): The Capacity of Labor Systems to Absorb AI-Driven Displacement
Definition: the ability of a labor market, sector, or economy to redeploy workers displaced by automation and AI into new roles through reskilling, mobility, and structural economic adaptation.
The Workforce Transition Elasticity Index (WTEI) measures how effectively a workforce system converts AI-driven disruption into productive reemployment rather than long-term unemployment, underemployment, or social strain. While indices such as DEI and AVI reveal where and how fast automation pressure emerges, WTEI captures the human absorption mechanism — the extent to which economies can pivot labor toward new skills, sectors, and value-creating activities.
At its core, WTEI reflects a simple but critical reality: automation is only economically beneficial if displaced workers can transition into new productive roles. High displacement exposure paired with low transition elasticity produces unemployment, inequality, and political instability. High elasticity transforms technological change into sustained growth and rising living standards. Understanding this capacity is therefore central to designing responsible AI-driven transformation.
What WTEI Measures: WTEI evaluates transition capacity across five integrated structural dimensions.
First, it measures Reskilling Throughput, capturing the scale, speed, and effectiveness of training systems in converting displaced workers into employable talent in emerging or transforming sectors. Second, it assesses Labor Mobility and Reallocation Speed, reflecting how easily workers move across roles, industries, and geographies through credential portability, hiring flexibility, and sector diversification. Third, WTEI incorporates Skills Alignment and Mismatch Levels, evaluating how closely educational outputs match evolving labor demand in high-augmentation and growth sectors. Fourth, it integrates Economic Diversification Depth, capturing whether new employment opportunities exist at sufficient scale to absorb displaced labor rather than concentrating opportunity in narrow elite sectors. Finally, it measures Social Safety Net Bridging Capacity, reflecting income support, retraining subsidies, and transition assistance that allow workers to reskill without falling into poverty or permanent labor detachment. Together, these factors determine whether automation produces sustainable productivity growth or systemic social stress.
How the Index Is Built: WTEI is constructed through labor-flow and skills-pipeline analysis. It integrates education throughput data, reskilling program outcomes, job mobility statistics, unemployment duration metrics, sector growth rates, and income transition support coverage. These are combined into elasticity profiles indicating how rapidly labor markets can reabsorb displaced workers under varying disruption scenarios. Rather than a single score, WTEI produces high-, medium-, and low-transition-capacity scenarios to reflect policy investment levels and institutional reform pathways.
What WTEI Enables: WTEI helps governments and organizations anticipate social risk hotspots before disruption peaks. It guides where to invest in training systems, how to sequence automation rollouts responsibly, which sectors require mobility incentives, and where economic diversification is urgent. It also allows firms to align transformation strategies with workforce readiness rather than triggering sudden displacement.
Who Uses It: Primary users include labor ministries, education authorities, development banks, social policy agencies, corporate HR strategists, and workforce transformation leaders.
Why It Matters: Many societies focus on how many jobs automation might replace — but far fewer measure how well people can transition afterward. History shows that technological revolutions succeed economically only when labor mobility keeps pace with innovation. Where transitions stall, inequality rises, political backlash grows, and growth slows.
WTEI reveals whether AI transformation will generate shared prosperity or destabilizing disruption.
Use Case—Applying WTEI in Practice: A middle-income country facing rising automation in banking, logistics, and administrative services uses WTEI to assess its readiness for workforce transition. The analysis shows strong technical universities but weak vocational reskilling, slow job mobility, and limited safety-net coverage. Although AI adoption promises major productivity gains, low elasticity indicates high unemployment risk. In response, the government launches fast-track digital retraining programs, employer-linked apprenticeships, mobility incentives, and income-bridging support, raising transition capacity before automation accelerates and stabilizing the labor market through the transformation period.

This illustration reflects a measure of where economic value remains structurally human despite advancing automation. While mechanical systems fade as tasks become digitized and standardized, work rooted in judgment, trust, creativity, care, and lived interaction leaves a lasting imprint. It is important to highlight the sectors where productivity cannot be separated from human presence, showing why some industries resist displacement even as AI scales rapidly elsewhere. Where human value density is high, technology augments rather than replaces—and where it is low, substitution accelerates.
5) Human Value Density Index (HVDI): Where Economic Value Remains Structurally Human
Definition: the proportion of economic activity within a sector, organization, or spatial system that fundamentally depends on human judgment, trust, empathy, creativity, physical presence, and lived interaction — making large-scale automation economically and socially constrained.
The Human Value Density Index (HVDI) measures how deeply human presence itself constitutes the core economic product within a given system of work. While indices such as DEI identify where tasks are technically automatable and AII captures productivity amplification, HVDI explains where automation structurally slows or stops because replacing people would destroy rather than enhance value. It captures the reality that not all inefficiency is waste — in many sectors, human interaction is the service being sold.
At its core, HVDI recognizes that economies are not built solely on efficiency. They are built on experience, trust, care, creativity, legitimacy, and emotional connection. Hospitals depend on clinical judgment and patient trust. Schools rely on mentorship and social development. Tourism thrives on hospitality and storytelling. Leadership depends on persuasion and accountability. In these domains, AI may optimize logistics and support decisions, but full substitution undermines outcomes and demand.
What HVDI Measures: HVDI evaluates human-anchored value creation across five integrated dimensions.
First, it measures Judgment and Accountability Intensity, capturing how central human responsibility, ethical reasoning, and contextual decision-making are to outcomes. Second, it assesses Relational and Trust Dependence, reflecting how much value creation relies on human-to-human interaction, credibility, care, and emotional intelligence. Third, HVDI incorporates Creative and Interpretive Contribution, measuring reliance on originality, cultural meaning, storytelling, and adaptive problem solving. Fourth, it evaluates Physical Presence and Embodied Skill, capturing sectors where real-world interaction, dexterity, or situational awareness remain essential. Finally, it integrates Social and Institutional Legitimacy Requirements, reflecting where human authority and oversight are necessary for public acceptance, legal accountability, and ethical governance. Together, these dimensions define where automation augments but does not replace.
How the Index Is Built: HVDI is constructed through task-value dependency mapping. Roles are decomposed into activities and evaluated for reliance on the five human-value dimensions above. Tasks that require sustained human presence and judgment score high on HVDI. These scores are weighted by time share and economic contribution, then aggregated across roles and sectors. Spatial versions of HVDI map districts and land uses where human-anchored value dominates — linking directly with SARI. Rather than static scores, HVDI is scenario-adjusted to reflect evolving social acceptance and regulatory norms.
What HVDI Enables: HVDI identifies structural safe zones of employment and economic resilience. It helps governments protect and expand human-centered sectors, guides investment toward experience economies, informs reskilling toward roles less susceptible to automation, and supports urban planning strategies focused on resilient districts. For businesses, it clarifies where human differentiation remains a competitive advantage.
Who Uses It: Primary users include policymakers, education systems, workforce strategists, urban planners, investors in service and experience economies, tourism authorities, healthcare systems, and cultural institutions.
Why It Matters: Many automation models assume efficiency always equals progress. HVDI shows that in vast portions of the economy, human presence is the value engine itself. Over-automation in high-HVDI domains repeatedly leads to service degradation, customer rejection, ethical backlash, and economic failure. Recognizing where people are irreplaceable is as important as knowing where machines can substitute. In essence, HVDI explains why some sectors remain employment anchors even in highly automated futures.
Use Case—Applying HVDI in Practice: A regional development authority wants to diversify its economy while protecting employment stability. Using HVDI, it maps sectors with structurally human-anchored value, including healthcare delivery, tourism services, education hubs, cultural industries, and personalized professional care. The analysis shows these areas combine strong economic demand with low automation risk. The authority then prioritizes investment incentives, training pipelines, and urban development zones around these human-centered industries — building long-term resilience while automation reshapes routine corporate sectors elsewhere.

This illustration captures the dynamic measure of how strongly financial markets reward AI-driven restructuring. As executives announce automation and workforce reduction, investor applause intensifies and stock lines rise. The mechanism is subtle but powerful—when markets equate efficiency with value creation, restructuring becomes performative as well as operational. Share price reaction becomes a feedback loop, amplifying automation incentives beyond pure productivity logic. There is a need to measure if and how much does financial signaling accelerate workforce compression—not because technology demands it, but because capital markets reward it.
6) Capital Market Signaling Sensitivity Index (CMSSI): When Financial Incentives Amplify AI-Driven Restructuring
Definition: the degree to which capital market incentives and investor expectations accelerate or amplify AI-linked workforce restructuring beyond what operational productivity gains alone would justify.
The Capital Market Signaling Sensitivity Index (CMSSI) measures how strongly financial markets reward firms for AI-driven cost compression, automation narratives, and workforce reductions — regardless of whether those changes reflect mature operational transformation. While DEI identifies structural automation exposure and AVI captures adoption speed, CMSSI explains why some organizations restructure aggressively even before productivity gains are fully realized.
At its core, CMSSI reflects a crucial reality: public markets respond to signals as much as to substance. When firms announce AI integration paired with margin expansion and headcount reduction, equity markets often reward the move immediately. This creates incentive loops where management teams pursue visible automation initiatives to meet investor expectations. In highly sensitive sectors, workforce compression may be driven as much by valuation signaling as by technological necessity.
CMSSI therefore captures the intersection between automation economics and capital psychology.
What CMSSI Measures: CMSSI evaluates financial amplification dynamics across five integrated dimensions. First, it measures Market Reaction Intensity, analyzing stock price responses to AI-related restructuring announcements relative to earnings fundamentals. Second, it assesses Narrative Weight in Investor Communications, evaluating how prominently automation, AI efficiency, and workforce reduction themes appear in earnings calls, annual reports, and investor briefings. Third, CMSSI incorporates Margin Pressure Sensitivity, reflecting how heavily firms are incentivized to demonstrate operating leverage in capital-intensive or growth-constrained environments. Fourth, it evaluates Peer Imitation and Competitive Signaling, capturing clustering behavior where firms replicate AI-linked layoffs to avoid appearing technologically behind. Finally, it integrates Valuation Premium for Automation Alignment, measuring whether markets consistently assign higher multiples to firms perceived as AI-forward. Together, these dimensions determine whether automation becomes a measured productivity tool or a market-driven restructuring accelerant.
How the Index Is Built: CMSSI is constructed through event-response and financial narrative analysis. It combines stock reaction data to AI-related announcements, earnings call transcript frequency analysis, margin trajectory modeling, valuation multiple comparisons, and sector-level clustering patterns. These are aggregated into a signaling sensitivity profile indicating how strongly financial incentives shape restructuring behavior. Rather than labeling actions as rational or irrational, CMSSI quantifies the degree to which market dynamics amplify operational change.
What CMSSI Enables: CMSSI helps regulators, investors, and corporate boards distinguish between genuine productivity transformation and narrative-driven compression. It identifies sectors at risk of automation bubbles, where restructuring may outpace operational readiness. It also clarifies where investor expectations are aligned with sustainable efficiency gains versus where short-term signaling may create long-term organizational risk. For policymakers, it signals where labor shocks may occur faster than technical feasibility alone would suggest.
Who Uses It: Primary users include institutional investors, regulators, central banks, corporate boards, equity analysts, and economic policymakers. It is particularly relevant in publicly traded sectors where automation narratives influence valuation dynamics.
Why It Matters: Technological change does not unfold in a vacuum. It unfolds within financial systems that reward visible efficiency, growth potential, and competitive signaling. If automation announcements consistently trigger positive market reactions, firms face pressure to demonstrate AI alignment — sometimes prematurely. This can produce workforce compression that reflects financial signaling more than realized productivity gains. In essence, CMSSI reveals where AI-driven restructuring is amplified by capital markets rather than purely determined by operational necessity.
Use Case—Applying CMSSI in Practice: A financial regulator observes that several publicly traded firms announce AI-driven restructuring within months of one another, accompanied by significant workforce reductions and positive stock reactions. Applying CMSSI, analysts detect strong market reaction intensity and clustering behavior across the sector. Although DEI shows moderate automation feasibility, CMSSI reveals high signaling sensitivity driving accelerated layoffs. In response, regulators and institutional investors engage firms on long-term workforce planning, ensuring restructuring reflects genuine operational modernization rather than short-term valuation incentives.

This illustration captures the widening gap between technological ambition and operational reality. On one side, automation exists in immaculate plans—perfectly optimized systems, frictionless workflows, and limitless efficiency. On the other, work unfolds amid physical constraints, human judgment, coordination failures, and real-world unpredictability. The future of AI is often designed on paper far faster than it can be absorbed on the ground. Productivity potential looks immediate, while workforce transformation remains slow, uneven, and constrained by infrastructure, skills, regulation, and human complexity. The true impact of automation is not defined by what technology can do—but by how much of it actually translates into lived economic change.

This illustration captures the growing distance between what artificial intelligence is technically capable of and what actually changes on the ground. While machines race ahead with accelerating speed, organizations, institutions, and labor systems often move far more slowly, constrained by infrastructure, regulation, culture, and human adaptation. Productivity potential builds rapidly, but real transformation lags behind. Understanding this gap is essential, not just to forecast innovation, but to measure how much promised automation becomes lived economic change—and how much remains theoretical momentum without real impact.
7) Automation Realization Gap Index (ARGI): The Distance Between AI Potential and Real-World Workforce Outcomes
Definition: the difference between modeled automation and augmentation potential within a sector or organization and the actual workforce, productivity, and operational outcomes observed after AI adoption.
The Automation Realization Gap Index (ARGI) measures how closely AI-driven transformation aligns with its technical promise. While indices such as DEI quantify substitution feasibility and AII captures productivity amplification, ARGI evaluates whether those capabilities translate into genuine operational impact — or whether restructuring outpaces, lags behind, or diverges from technological reality.
At its core, ARGI reflects a simple but powerful question: Is AI delivering real transformation, or merely driving perception-driven change? In some environments, firms announce automation initiatives but achieve limited productivity improvement. In others, workforce compression occurs before systems are fully integrated. Conversely, some organizations quietly transform operations without public layoffs. ARGI captures all these divergences.
What ARGI Measures: ARGI evaluates realization alignment across five integrated dimensions. First, it measures Productivity Outcome Alignment, comparing expected efficiency gains from modeled automation with actual output, cost, and performance improvements. Second, it assesses Workforce Change Consistency, analyzing whether reductions, role shifts, or redeployments match the scale of technical automation achieved. Third, ARGI incorporates Operational Integration Depth, capturing how fully AI systems are embedded into core workflows rather than isolated pilot projects. Fourth, it evaluates Timeline Synchronization, measuring whether workforce changes occur before, during, or after operational capability matures. Finally, it integrates Outcome Sustainability, assessing whether improvements persist or regress after initial deployment. Together, these factors reveal whether AI transformation is substantive or symbolic.
How the Index Is Built: ARGI is constructed through capability-outcome mapping. Modeled automation exposure and augmentation potential (from DEI and AII) are compared with observed metrics such as productivity growth, headcount changes, process cycle time, error rates, and financial performance. Discrepancies are aggregated into a realization gap profile: (i) Positive gap — real productivity exceeds modeled potential; (ii) Neutral gap — transformation aligns with feasibility; and (iii) Negative gap — restructuring outpaces real operational change. This produces a clear picture of substance versus signal.
What ARGI Enables: ARGI allows leaders to audit transformation effectiveness. It highlights where AI investments are delivering real value, where workforce changes are premature, and where hype may be masking limited operational progress. For policymakers and regulators, it identifies sectors where labor compression may reflect narrative momentum rather than technological maturity.
Who Uses It: Primary users include corporate transformation leaders, investors, regulators, economic planners, operational strategists, and audit bodies.
Why It Matters: AI transformation often unfolds under intense narrative pressure. Without outcome verification, organizations may restructure too aggressively, misallocate capital, or damage long-term capability. In essence, ARGI distinguishes sustainable productivity revolution from perception-driven disruption.
Use Case—Applying ARGI in Practice: A multinational service firm announces major AI-driven automation and reduces administrative headcount by 20 percent. Using ARGI, analysts compare projected automation feasibility with actual system integration and productivity data. The results reveal limited workflow automation and minimal efficiency gains, indicating a large negative realization gap. Leadership pauses further layoffs, redirects investment toward deeper process redesign, and sets performance-based automation benchmarks — ensuring future workforce changes align with real operational progress rather than narrative expectations.
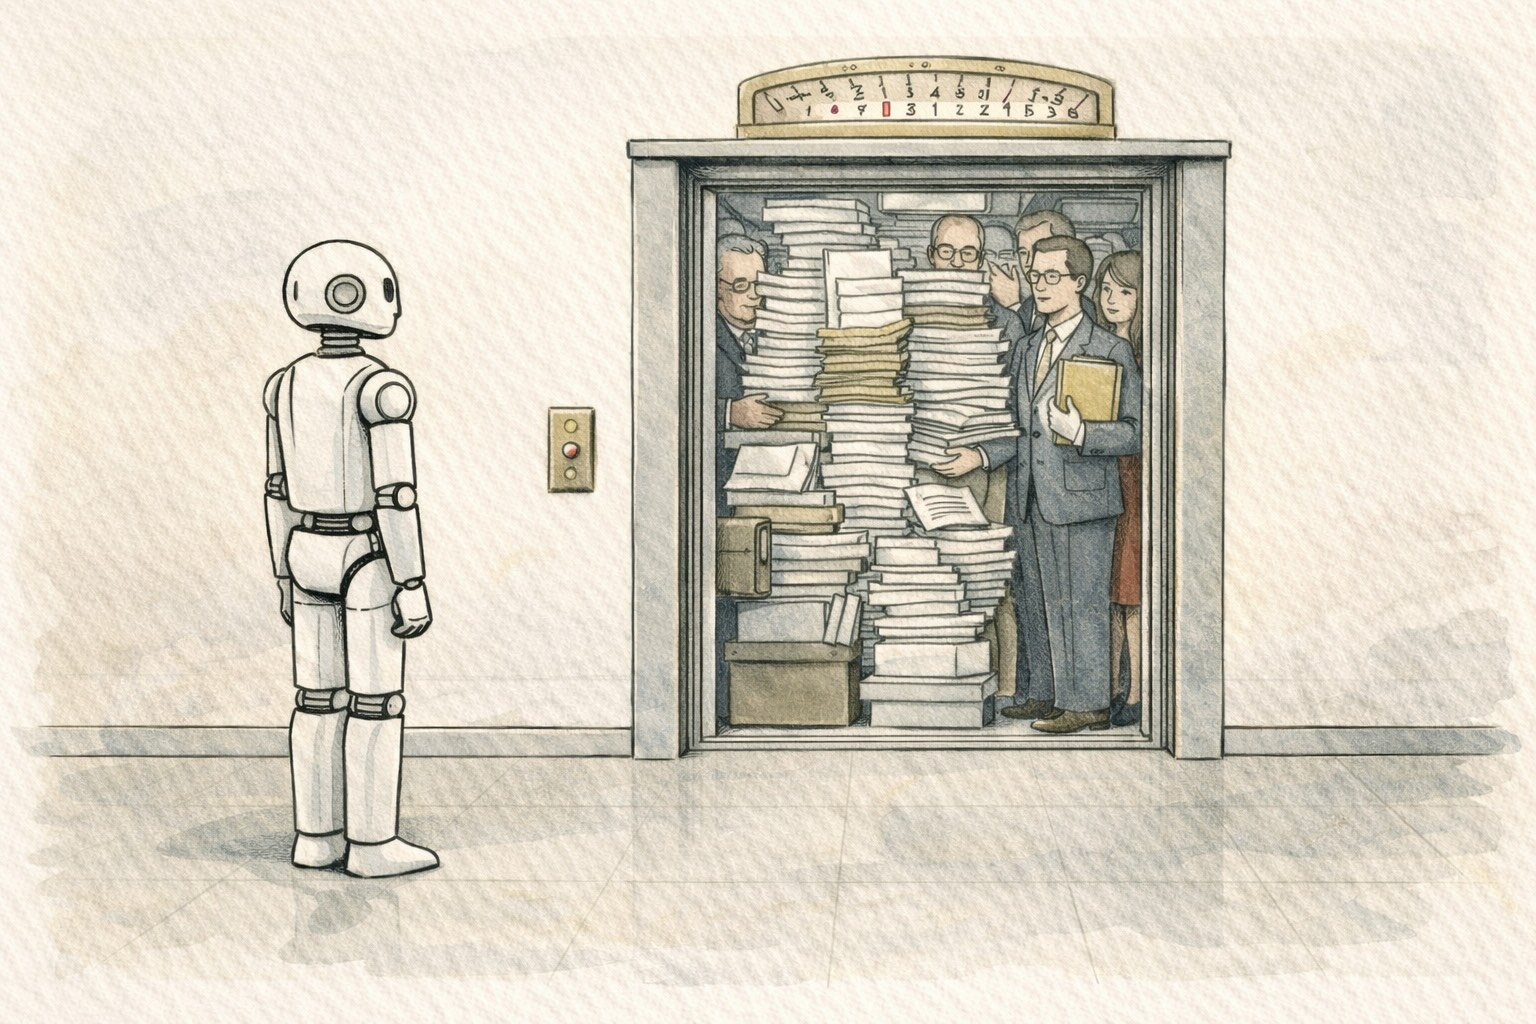
This illustration captures the widening gap between technological capability and institutional motion where machines are ready to move faster than organizations, regulations, and labor systems can adapt. While automation waits efficiently at the door, human structures remain crowded with procedures, approvals, and legacy processes that slow real workforce transformation. The future of work will be shaped not only by what technology can do, but by how quickly institutions can reorganize roles, retrain people, redesign governance, and absorb change without social breakdown. Measuring this organizational velocity is essential to understanding when innovation becomes impact—or simply bottlenecked potential.
8) Institutional Restructuring Speed Index (IRSI): The Systemic Pace at Which Workforces Can Be Reorganized
Definition: the speed at which legal frameworks, labor institutions, regulatory systems, and organizational governance allow AI-driven workforce restructuring to occur across sectors and economies.
The Institutional Restructuring Speed Index (IRSI) measures how rapidly workforce transformation can unfold once AI-driven automation and organizational redesign become technically and economically viable. While indices such as DEI identify exposure, AVI captures adoption momentum, and ARGI evaluates realization quality, IRSI reflects the institutional transmission layer — the degree to which labor laws, regulatory processes, governance norms, and political constraints either accelerate or slow structural change.
At its core, IRSI recognizes that technological capability alone does not determine disruption timelines. Two economies with identical automation feasibility may experience vastly different outcomes depending on employment protections, unionization structures, regulatory oversight, public sector employment share, and organizational governance practices. In high-speed environments, firms can restructure rapidly in response to market pressure. In low-speed environments, transformation unfolds gradually through attrition, retraining, or negotiated change.
What IRSI Measures: IRSI evaluates institutional restructuring capacity across five integrated dimensions. First, it measures Labor Market Flexibility, capturing the ease of hiring, firing, contract modification, and role restructuring within legal frameworks. Second, it assesses Regulatory and Compliance Friction, reflecting approval processes, oversight requirements, and sector-specific labor protections that affect restructuring speed. Third, IRSI incorporates Unionization and Collective Bargaining Influence, evaluating how strongly workforce representation shapes the pace and form of organizational change. Fourth, it evaluates Public Sector Employment Weight, recognizing that government-heavy labor systems typically transform more slowly than private-sector-dominant economies. Finally, it integrates Corporate Governance Agility, capturing how quickly leadership structures can approve, fund, and execute workforce redesign. Together, these factors determine whether AI-driven transformation occurs in sudden waves or gradual evolution.
How the Index Is Built: IRSI is constructed through institutional constraint and governance mapping. It combines labor law rigidity indicators, regulatory approval timelines, union density statistics, public employment ratios, corporate decision-cycle benchmarks, and historical restructuring patterns across sectors. These variables are aggregated into speed profiles indicating high-velocity, moderate-velocity, and low-velocity restructuring environments. Rather than predicting specific layoffs, IRSI forecasts the temporal shape of workforce transformation — rapid compression versus slow adaptation.
What IRSI Enables: IRSI allows policymakers, businesses, and investors to anticipate how fast disruption will materialize once automation becomes viable. It informs the sequencing of reskilling programs, regulatory modernization, social protection systems, and transformation strategies. For firms operating across jurisdictions, it clarifies where restructuring can occur quickly and where gradual workforce evolution is more realistic.
Who Uses It: Primary users include labor ministries, regulators, multinational corporations, investors, development institutions, workforce planners, and governance strategists.
Why It Matters: Automation exposure alone does not determine social impact — speed does. Rapid restructuring can overwhelm labor markets and institutions, while slower transitions allow adaptation and reskilling. Without measuring institutional velocity, governments risk reacting too late or regulating prematurely. In essence, IRSI explains the tempo of AI-driven economic change—whether it arrives as shockwaves or gradual transformation.
Use Case—Applying IRSI in Practice: A multinational technology firm plans to automate back-office and customer operations across three major regions. Using IRSI, it evaluates institutional restructuring speed in each jurisdiction. The analysis reveals high labor flexibility and rapid approval processes in one market, moderate restructuring constraints in another, and strong union protections and regulatory oversight in the third. Although DEI shows similar automation exposure across all regions, IRSI indicates that workforce compression would occur within months in the first market but over several years in the most regulated one. The firm sequences transformation accordingly, aligning reskilling, communication, and compliance strategies with institutional pace rather than technological capability alone.
Thinking of a country as a building, this illustration shows how artificial intelligence reshapes an economy unevenly, floor by floor. Digital sectors at the top transform fastest, industrial systems in the middle reorganize work, while human-centered services below remain more resilient. The true impact of AI depends not on headlines or investment volume, but on how much of a nation’s economic structure sits in each layer. Measuring where employment is concentrated across digital, physical, and human value sectors reveals which economies face rapid workforce compression and which will experience slower, more buffered transitions.
9) National AI Workforce Exposure Index (NAIWEI): The Structural Vulnerability of National Economies to AI-Driven Labor Transformation
Definition: the weighted exposure of a country’s workforce to AI-driven automation and augmentation based on sectoral employment composition, task-level displacement feasibility, and institutional transmission dynamics.
The National AI Workforce Exposure Index (NAIWEI) measures how structurally vulnerable or resilient a national economy is to AI-driven workforce transformation by translating sector-level automation exposure into macroeconomic impact. While DEI identifies where tasks are technically substitutable and AVI captures adoption speed, NAIWEI aggregates these dynamics across GDP and employment structures — revealing how a country’s economic composition shapes its exposure to disruption.
At its core, NAIWEI recognizes that every national economy functions as a portfolio of sectors. Countries heavily concentrated in digital services, finance, standardized professional work, and administrative functions carry higher structural exposure to automation. Economies anchored in tourism, healthcare delivery, education, agriculture, and experience-based services tend to exhibit greater resilience. By weighting automation exposure according to each sector’s employment and economic contribution, NAIWEI produces a realistic picture of national transformation pressure.
What NAIWEI Measures: NAIWEI evaluates national exposure across four integrated components. First, it measures Sectoral Displacement Exposure, applying DEI scores to each major industry within the economy. Second, it incorporates Employment Concentration Weighting, reflecting how many workers are engaged in each exposed sector. Third, it integrates Augmentation-Dominant Sector Presence, capturing where productivity growth is likely without major job loss. Fourth, it adjusts for Institutional Restructuring Speed, reflecting how rapidly workforce change can unfold within national labor frameworks. Together, these components produce a comprehensive exposure profile rather than a simplistic national risk score.
How the Index Is Built: NAIWEI is constructed through sector-weighted aggregation using standardized national accounts and labor statistics, such as UN ISIC classifications, national labor force surveys, and GDP contribution data. Each sector’s automation exposure and augmentation intensity are multiplied by employment and output shares, then adjusted by institutional velocity indicators (from IRSI). The result is a range of exposure scenarios reflecting adoption speed and regulatory context. Rather than predicting unemployment rates, NAIWEI reveals structural transformation pressure embedded within economic composition.
What NAIWEI Enables: NAIWEI allows governments to anticipate where workforce disruption will concentrate nationally, prioritize reskilling investment, diversify economic structures, and design phased transition strategies. It also supports development banks and investors in assessing macroeconomic resilience to technological change and targeting growth sectors with strong augmentation potential.
Who Uses It: Primary users include finance ministries, labor ministries, economic planning agencies, central banks, development institutions, sovereign wealth funds, and international organizations.
Why It Matters: Global automation debates often treat countries uniformly. In reality, economic structure determines exposure. Two nations adopting identical AI technologies may experience vastly different social outcomes depending on sector mix. NAIWEI makes those differences measurable, allowing proactive policy rather than reactive crisis management.
Use Case — Applying NAIWEI in Practice: A national economic council wants to understand why recent AI adoption has triggered layoffs in one peer country but not another. Using NAIWEI, analysts compare sector compositions and find that one economy is heavily concentrated in finance, digital services, and administrative work with high displacement exposure, while the other is anchored in tourism, healthcare delivery, and education with high human value density. The council uses these insights to diversify growth strategy, expand reskilling pipelines, and prioritize augmentation-driven sectors, reducing long-term vulnerability while maintaining productivity growth.
As AI compresses labor in some sectors while barely touching others, financial risk and opportunity begin to track structural exposure rather than headlines. Firms built on routine digital work surge in productivity but carry transition volatility, while human-centered industries remain steadier but scale differently. What markets ultimately price is not AI adoption itself, but how strongly workforce transformation flows into earnings, resilience, and long-term value creation.
10) Capital Market & Portfolio AI Exposure Index (CMPEI): The Transmission of AI Workforce Transformation into Financial Risk and Opportunity
Definition: the weighted exposure of stock market indices, investment portfolios, mutual funds, and asset classes to AI-driven workforce restructuring based on sector composition, company-level automation vulnerability, and capital signaling dynamics.
The Capital Market & Portfolio AI Exposure Index (CMPEI) measures how deeply AI-driven automation and organizational transformation are embedded within financial markets. While NAIWEI translates sector exposure into national economic vulnerability, CMPEI extends the same logic into capital allocation systems, revealing how investors are implicitly exposed to workforce compression, productivity restructuring, and automation-driven margin shifts.
At its core, CMPEI recognizes that financial instruments are simply portfolios of economic activities. Stock indices are weighted collections of firms across sectors. Mutual funds, ETFs, pension funds, and sovereign portfolios are layered combinations of these assets. By mapping each component’s automation exposure and transformation profile, CMPEI converts workforce restructuring dynamics into measurable financial risk and opportunity.
What CMPEI Measures: CMPEI evaluates capital exposure across four integrated dimensions. First, it measures Sectoral Automation Weighting, applying DEI and AII scores to the industry composition of indices and portfolios. Second, it incorporates Company-Level Transformation Profiles, capturing firms’ operational exposure, adoption velocity, and realization gaps. Third, CMPEI integrates Capital Signaling Sensitivity, reflecting how market incentives amplify restructuring behavior. Fourth, it assesses Concentration Risk, identifying whether exposure is diversified or clustered in highly automatable industries. Together, these elements reveal how sensitive financial assets are to AI-driven labor transformation.
How the Index Is Built: CMPEI is constructed through portfolio exposure mapping. Each index or fund is decomposed into sector and company weights. Automation exposure and augmentation potential are assigned to each component using DEI, AII, AVI, and CMSSI metrics. These are aggregated to produce an overall exposure profile showing vulnerability, resilience, and productivity upside. Rather than predicting market performance, CMPEI identifies structural transformation embedded within asset composition.
Why It Matters: AI is not only transforming labor markets — it is reshaping earnings structures, cost bases, and competitive advantage across firms and sectors. Without exposure mapping, investors may unknowingly concentrate portfolios in industries facing structural workforce compression or hype-driven volatility. CMPEI makes technological transformation financially visible.
Who Uses It: Primary users include asset managers, pension funds, sovereign wealth funds, institutional investors, financial regulators, and risk analysts.
What CMPEI Enables: CMPEI allows investors to understand hidden automation risk concentration, rebalance portfolios toward resilient or augmentation-driven sectors, and anticipate valuation shifts linked to AI-driven restructuring. For regulators and pension funds, it supports systemic risk monitoring tied to technological transformation.
Use Case—Applying CMPEI in Practice: A pension fund seeks to evaluate long-term risk across its equity portfolio. Applying CMPEI, analysts discover heavy exposure to financial services, standardized professional services, and digital platforms with high displacement exposure and strong capital signaling sensitivity. Meanwhile, the fund has limited allocation to human-centered sectors such as healthcare delivery and experience economies. Using these insights, managers rebalance toward resilient and augmentation-driven industries, reducing structural disruption risk while maintaining productivity growth upside over the coming decades.
This illustration captures how artificial intelligence will reshape and be reshaped by cities unevenly, concentrating growth, automation, and digital activity in some districts while leaving others structurally exposed. Measuring resilience requires moving beyond abstract job numbers to the physical economy itself, examining where automated industries cluster, where human-centered work remains anchored, and how land use, mobility, and urban form can adapt to rapid economic change. By translating workforce transformation into streets, buildings, and neighborhoods, planners can identify which areas will absorb disruption, which will thrive, and which risk decline as AI-driven restructuring accelerates.
11) Spatial AI Resilience Index (SARI): The Urban Layer of AI Economic Transformation
Definition: the structural resilience or vulnerability of urban form and land-use systems to AI-driven economic transformation.
The Spatial AI Resilience Index (SARI) measures how vulnerable or resilient a city, district, or master plan is to AI-driven economic restructuring by analyzing land use composition, employment concentration, urban form flexibility, and the spatial distribution of high- and low-automation activities. While most automation frameworks assess labor markets abstractly through jobs and sectors, SARI translates workforce transformation into its physical economic footprint — revealing how artificial intelligence reshapes demand for office space, industrial land, logistics hubs, housing typologies, transit systems, and experiential urban environments.
At its core, SARI recognizes that economies do not exist only in spreadsheets. They exist in buildings, zoning plans, transport corridors, infrastructure networks, and spatial clusters of activity. When AI compresses routine corporate work, it does not merely reduce headcount; it alters the viability of central business districts, the density of commercial towers, the demand for daily commuting, and the financial logic of mono-functional office zones. Conversely, when AI augments human-centered sectors such as tourism, healthcare delivery, culture, education, and hospitality, it strengthens districts built around experience, interaction, and service ecosystems.
What SARI Measures: SARI evaluates urban resilience across six integrated spatial dimensions.
First, it measures Land Use Automation Exposure Mix, calculating the share of built floor area and employment capacity devoted to high-displacement activities (corporate offices, administrative centers, call centers, standardized professional services), reshaping activities (manufacturing parks, logistics districts, infrastructure operations), and resilient human-centered uses (tourism zones, hospitality clusters, healthcare districts, educational campuses, cultural quarters). Cities heavily weighted toward routine digital office functions show structurally higher vulnerability to long-term demand erosion, while mixed-use and experience-driven environments display stronger resilience. Second, SARI assesses Employment Density Sensitivity, capturing how many workers per square meter are concentrated in automatable roles. Dense business districts built around standardized knowledge work face sharper economic shocks when automation compresses headcount, while lower-density experiential and service districts experience more gradual change.
Third, the index incorporates Urban Fabric Flexibility, evaluating how easily land uses can adapt as economic structure shifts. Districts with convertible office-to-residential layouts, adaptable mixed-use zoning, and infrastructure designed for functional transformation score higher resilience. Rigid mono-use business parks, single-function CBDs, and highly specialized commercial towers score lower. Fourth, SARI measures Mobility and Commuting Exposure, analyzing how dependent urban systems are on daily flows of routine corporate workers. Cities whose transit revenues, road congestion patterns, and service economies rely heavily on nine-to-five office commuting face greater structural disruption as remote work and automation reduce centralized employment density.
Fifth, it integrates Human Value Density by District, mapping where economic value is anchored in human presence, trust, creativity, and lived experience. These areas — historic centers, tourism corridors, cultural districts, medical hubs, education zones — remain structurally protected from large-scale labor substitution and often grow in relative importance as routine work automates. Finally, SARI accounts for Digital Infrastructure Concentration, including data centers, fiber networks, innovation hubs, and automation-intensive logistics systems that shape new spatial economic clusters emerging alongside AI-driven productivity growth.
How the Index Is Built: SARI is constructed through spatial overlay analysis combining land-use plans, zoning data, building typologies, employment distribution, sectoral automation exposure scores, mobility flows, and infrastructure mapping. Each urban parcel or planning zone is weighted according to its functional exposure to displacement, reshaping, or augmentation dynamics identified in Parts I and II of the framework. Rather than predicting property values or specific job losses, SARI produces a structural vulnerability and resilience profile for urban systems — showing where economic activity is likely to contract, transform, or strengthen as AI adoption accelerates. Importantly, results are scenario-based, reflecting different adoption speeds, regulatory responses, and urban redevelopment strategies.
What SARI Enables: SARI allows planners and decision-makers to anticipate long-term shifts in urban demand before they become crises. It identifies CBDs likely to face office oversupply, transit corridors vulnerable to reduced commuting flows, industrial zones poised for logistics expansion, and experiential districts positioned for growth. For development agencies and municipalities, it informs zoning reform, regeneration priorities, housing strategy, and infrastructure investment. For real estate investors and sovereign funds, it reveals which asset classes face structural decline versus resilience. For national governments, it connects labor transformation directly to urban economic stability.
Who Uses It: Primary users include city governments, urban planning authorities, development banks, sovereign wealth funds, real estate developers, infrastructure investors, transportation agencies, and ministries of economy and housing. It is especially valuable in rapidly transforming regions such as the GCC, emerging megacities, and post-industrial urban cores undergoing regeneration.
Why It Matters: Most AI workforce models stop at employment statistics. SARI demonstrates that automation is also an urban shock and opportunity engine. It reshapes how cities function, where people live and work, how transport systems operate, and what kinds of districts thrive. By translating AI-driven labor restructuring into spatial economic consequences, SARI makes the future of work tangible, actionable, and governable.
Use Case—Applying SARI in Practice: A fast-growing coastal city plans a new central business district anchored in high-rise offices, transit hubs, and mixed commercial zoning. Before finalizing the master plan, the municipality applies SARI to model long-term AI-driven economic shifts. The analysis reveals heavy exposure to routine corporate functions likely to compress over the next decade, alongside strong resilience in tourism, culture, healthcare, and experiential retail. Using these insights, planners rebalance land uses toward mixed-use districts, residential conversion flexibility, innovation hubs, and expanded hospitality corridors—future-proofing the city’s economic base, stabilizing transit demand, and reducing vacancy risk before development begins.
Two hands redraw the same city, one guided by human judgment, the other by machine logic, while a crowd watches the future take shape. The scene captures how economic transformation is not a single forecast, but a continuous process of measurement, feedback, and adaptation. As technology reshapes work, value, and space, understanding emerges from tracking pressures, resilience, and real-world outcomes in motion. The map is never finished, because the economy itself is evolving—requiring living systems of insight rather than static predictions.
From Measurement to Foresight: Building a Living Map of AI’s Economic Transformation
Together, OHK’s eleven integrated indices form a comprehensive system for understanding how artificial intelligence reshapes work across tasks, sectors, economies, cities, and financial markets. From Displacement Exposure and Augmentation Intensity to Adoption Velocity, Workforce Transition Elasticity, Human Value Density, capital-market amplification, institutional speed, national exposure, portfolio risk, and spatial resilience, the framework moves beyond single-number forecasts toward a structural map of transformation dynamics.
Rather than predicting headlines, it reveals where pressure builds, where resilience anchors value, where transitions succeed or fail, and how narrative forces accelerate change. Importantly, the framework is designed as a living analytical system — continuously refined as technology evolves, labor markets adapt, and new economic patterns emerge. OHK will continue expanding, stress-testing, and extending these measures, including new spatial, institutional, and productivity dimensions, to ensure the framework remains aligned with the real mechanics of economic transformation in the AI era.
On Methodology Transparency and Ongoing Development
While this Part III presents the conceptual structure, analytical logic, and practical application of OHK’s indices, the detailed mathematical formulations, weighting schemes, and calibration models remain proprietary components of OHK’s research and consulting platform. These quantitative tools have been developed through extensive task-level modeling, empirical benchmarking, and scenario testing to ensure realistic representation of economic transformation dynamics.
In Part II, OHK presented the structural logic and proof-of-concept methodology underlying the Displacement Exposure Index (DEI), including task-level decomposition, feasibility scoring across core automation dimensions, substitution versus augmentation adjustments, and sector-weighted aggregation to generate exposure ranges. This transparency demonstrates how automation vulnerability is analytically constructed and empirically grounded. However, the full mathematical specifications, coefficient weightings, calibration datasets, friction adjustments, and scenario-design parameters that operationalize DEI—and the broader multi-dimensional framework—remain proprietary components of OHK’s applied research platform. These quantitative engines have been refined through iterative modeling and benchmarking to ensure realistic representation of economic transformation dynamics while supporting scalable application across sectors, economies, and spatial systems.
That said, OHK recognizes the value of methodological clarity and consistent application. As the framework continues to mature, OHK is actively considering the release of a technical implementation manual that would outline standardized measurement approaches, data inputs, and scenario construction principles for policymakers, researchers, and practitioners. This balance allows OHK to protect core intellectual property while supporting responsible, transparent, and scalable use of the framework across diverse economic contexts.
Together, these three parts reflect over two years of applied research— culminating in Part III, where OHK moves beyond commentary to build and operationalize a measurable framework for understanding AI’s real economic impact.

This article is part of OHK’s ongoing series on artificial intelligence broadly and the future of work specifically, examining how AI is reshaping organizations, economies, and operating models across industries.
At OHK, our work on the future of work and AI-driven transformation is grounded in real-world organizational redesign, not abstract technology forecasts. We support governments, development institutions, and private-sector leaders in translating artificial intelligence into sustainable operating models that improve productivity while preserving execution resilience, workforce stability, and social legitimacy. From workforce transformation strategies and automation roadmaps to productivity measurement frameworks and policy-ready labor transition planning, we help organizations distinguish genuine AI-driven modernization from narrative-led restructuring that risks long-term correction. Our hybrid expertise across management consulting, economic planning, and international development enables us to design transformation programs that integrate technology deployment with governance capacity, skills development, and institutional reform. If your organization is navigating AI adoption, workforce restructuring, or future-of-work strategy, contact us; OHK can support you in building automation responsibly, measuring impact rigorously, and redesigning work for long-term value creation rather than short-term cost compression.